
Consumer trends in 2026 are more complicated than shoppers simply spending less. Four years of rising prices have changed how people make purchasing decisions, but not necessarily what they are prepared to give up.
Shoppers are planning more carefully, reconsidering how and when they buy, and becoming more deliberate about what deserves their money. Yet some priorities remain surprisingly consistent. At one grocery retailer, the preference for organic products has strengthened. In apparel, many buyers still arrive without a specific purchase in mind. And getting a discount doesn’t always mean someone feels they’ve received good value.
These shopping trends create a challenge for retailers. Sales data shows what people bought, but it doesn’t always explain the decisions behind those purchases. A smaller transaction could reflect a change in shopping frequency rather than reduced loyalty. A promotion might secure a sale without improving how shoppers feel about the retailer.
TruRating’s Shopper Insights 2026 report explores these differences using answers collected directly from paying customers. Drawing on research from participating retailers across North America, Europe and Australia, it examines how purchasing decisions are changing, which behaviors are proving resilient, and what retailers can learn from the experiences behind each sale.
The findings cover grocery, apparel and footwear, raising wider questions about customer loyalty, product availability, service execution and the meaning of value. Throughout the report, we look at what shoppers told us, what the transaction data adds, and how retailers can use those findings to make better decisions.
2026 at a glance
Four findings show how shoppers are adjusting their decisions while holding on to familiar priorities.
Used a shopping list
Paying shoppers at a European discount grocer in September 2026, up from 56.0% in October 2025.
See shopping-list data Holding on to priorities 43.6%Tried to buy organic
Paying shoppers at the same European discount grocer in September 2026, up from 41.0% in January 2026.
See organic trend Arriving undecided 37–42%Came in just browsing
Share of buyers at a US off-price department store each month, January to September 2026.
See reasons for visiting Shopping for others 26.0%Buying for somebody else
Buyers across a US athletic footwear retailer and an Australian apparel retailer, February to June 2026.
See gift-buyer findingEach figure reflects the retailer or retailers specified. These are observations from participating businesses, not market-wide estimates.
How we know
TruRating asks one question at the payment terminal, answered in about two seconds by someone who has just paid. The purchase is verified, and the answer is anonymous. Our point of payment feedback links each answer to the transaction, including what was bought, when, where and for how much. That allows us to examine what shoppers experienced alongside their purchasing behavior.
The research draws on questions asked at participating retailers rather than a consumer panel. Each chart identifies the retailer type, observation period, question and sample. Figures collected at one retailer should not be treated as averages for the wider market.
The backdrop: where the pressure is landing
Prices are still rising, and shoppers are changing what they buy rather than simply whether they buy. According to the US Bureau of Labor Statistics, food-at-home prices increased 1.8% in the 12 months to September 2026. Apparel prices rose 3.4% over the same period.
The 2026 price backdrop
Prices continued to rise
US consumer price changes in the 12 months to September 2026.
Food at home
+1.8%Year-over-year price increase
Apparel
+3.4%Year-over-year price increase
Source: US Bureau of Labor Statistics, Consumer Price Index, released October 14, 2026. Twelve-month changes, not seasonally adjusted.
These increases sit on top of several years of higher prices. But the evidence does not suggest shoppers are simply trading down. They are adjusting their routines, purchase frequency and spending priorities, while continuing to protect things that matter to them.
In his analysis of grocery client data, Gareth Johns has observed, across participating grocers, dollar sales have been barely ahead of the previous year, while fewer items are passing through the register. Rather than simply abandoning purchases, shoppers are changing the frequency and purpose of their trips.

“The shopping horizon is narrowing. There’s much more shopping for one or two days, or for the evening meal, rather than shopping for the week.”
Smaller purchases can therefore tell a different story from falling demand. A shopper buying tonight’s dinner may return tomorrow for something else. Retailers need to distinguish shorter, more frequent trips from a genuine decline in demand when reviewing sales, basket size and promotional results.
1. The shopping list is back in charge
One of the clearest grocery shopping trends in the research concerns how shoppers plan their trips. At a European discount grocer, shopping-list use strengthened through 2026. In October 2025, 56.0% of paying shoppers said they used a shopping list. By September 2026, the figure had reached 60.4%, its highest reading since the question began.
List use stayed above the October baseline in every subsequent reading, although it did not increase every month. Shoppers arriving with a list have already decided at least part of what they intend to buy before entering the store. Displays, end caps and promotions must compete with a more deliberate approach to the trip. For grocery retailers, understanding planned purchases is becoming increasingly important.
Shopper Insights 2026 · European discount grocer
Shopping lists and organic intent finished at their highest readings
Shopping-list use stayed above its October 2025 baseline. Organic purchasing intent also increased between January and September 2026.
Dashed line: November and December 2025 were not measured. This segment connects the observed October and January readings, not estimated monthly values.
At this retailer, shopping-list use reached 60.4% in September 2026, up from 56.0% in October 2025. Organic intent reached 43.6%, up from 41.0% in January 2026.
Capture the list and understand the trip
A shopping list also offers a way to understand what someone intended to buy. When a retailer knows the contents of a list, it can help the shopper find products, identify alternatives when items are unavailable, and suggest ingredients that fit the meal they are planning.
Gareth Johns has observed that shoppers value grocery apps that help them navigate stores. That points to an opportunity for retailers to make their apps more useful, helping customers find products and complete planned purchases alongside promotional messaging. This observation comes from TruRating client work rather than the polling series shown here.
But behavior differs substantially between retailers. A US value grocer asking the same shopping-list question recorded figures between 23% and 28% from July to September 2026. List use varies considerably between these retailers. Each needs to understand how its customers plan their trips before deciding what support to offer.
Try this in your stores
Ask shoppers at the register, “Did you use a shopping list today?” Compare basket size, transaction value and reported shopping experiences between list users and non-list users. Look at differences by store, day and time rather than assuming the same behavior applies across the estate.
2. Shoppers’ values held. Your shelves have to keep up
You might expect organic products to be among the first things shoppers give up when budgets tighten. At one European discount grocer, the opposite happened. The proportion of paying shoppers who said they tried to buy organic products rose from 41.0% in January 2026 to 43.6% in September, the highest reading in the available series.
The increase was modest, but the direction is important. Even as shoppers adjusted their spending, this preference held. The result does not mean every shopper is willing to pay more for organic products. It shows that, among shoppers at this retailer, a preference for organic remained important through the period measured.
Gareth sees similar commitment among shoppers who prioritize eating clean. That creates a challenge for range planning and replenishment. Shoppers with firm preferences can be less willing to accept substitutions.
Someone shopping for a ready-made pizza may be happy to choose a different variety. Someone buying ingredients for a specific recipe may have far less flexibility.
“If I’ve been sent to the shop to buy ginger, I have no idea what my substitute for ginger is. But if I’ve been sent for a pepperoni pizza, I can come home with a ham and mushroom and it’ll probably be okay.”
Gareth also sees signs of more cooking from scratch, potentially at the expense of ready meals. For those shoppers, a missing ingredient may compromise the whole purpose of the trip.
Availability is about which items are missing
Most grocers already monitor product availability. But an overall in-stock percentage does not explain whether the missing products are the ones shoppers came to buy. The impact of an out-of-stock item depends on how easily it can be substituted.
A shopper may replace one brand with another without much thought. A missing specialist ingredient, preferred organic product or essential meal component can be harder to replace. That makes availability a question of protecting the products shoppers are least prepared to compromise on.
Try this in your stores
Identify products shoppers consider essential to completing a planned shop. Ask list users whether they found everything they came for, then compare their answers with the transaction. Look for products whose absence is associated with incomplete purchases or lower spending.
3. Store friction is associated with return visits
Price, promotions, freshness, cleanliness and staff friendliness are familiar measures of grocery experience. But when we examine the relationship between customer experience and repeat visits, we often find that more practical aspects of the shopping trip matter most.
Could shoppers move around the store easily? Could they reach checkout without difficulty? How easily could they complete their purchase? These points of friction can be particularly important for people making smaller, more frequent trips.
How store friction relates to repeat visits
Most grocery shoppers already use more than one retailer. A poor visit does not necessarily mean they stop shopping with a business altogether. Instead, they may return less frequently or spend a smaller proportion of their grocery budget there.
For repeat customers, the cost of a difficult visit may be a longer gap before the next purchase rather than losing the shopper completely. Because TruRating links anonymous answers to transaction records, it can examine how reported experiences relate to subsequent purchases and repeat visits.
In Gareth’s client analysis, poorer ratings for movement and checkout were more strongly associated with weaker return behavior than several traditional service measures. This is an observational relationship, not proof of causation.
Shopper Insights 2026 · Store experience
Three points of friction
The practical parts of a grocery visit that Gareth Johns found most closely associated with whether shoppers return.
Move around the store
Can I move around the store easily?
Aisle access, displays and replenishment
Reach the checkout
Can I get to the checkout easily?
Store navigation and checkout access
Complete checkout
Can I get through the checkout easily?
Waiting, queue movement and payment flow
The problem with crowded stores
We’ve also observed a tipping point in smaller stores. By examining customer volumes alongside store square footage, we’ve found that ease-of-movement ratings can begin to decline once stores become too crowded, alongside measures of return behavior.
There is no universal threshold. The point at which crowding becomes a problem depends on the store and its layout. But it raises an important consideration for retail store layout and day-to-day store operations.
An aisle-end display might generate additional sales while obstructing movement. Replenishment during busy periods might improve availability but make it harder for shoppers to reach the products they want. A store’s footprint may be difficult to change, but how that space is used is not.
Try this in your stores
Compare ease-of-movement and checkout ratings across busy and quiet periods. Look for stores where customer ratings deteriorate as footfall increases. Review aisle obstructions, replenishment schedules and checkout flow before assuming the answer is another service initiative.
4. Nearly two in five buyers came in just browsing
In grocery, shoppers generally arrive intending to buy. Apparel is different. Across the apparel retailers we work with, we typically see conversion rates of around 15% to 20%. That means most visitors leave without making a purchase.
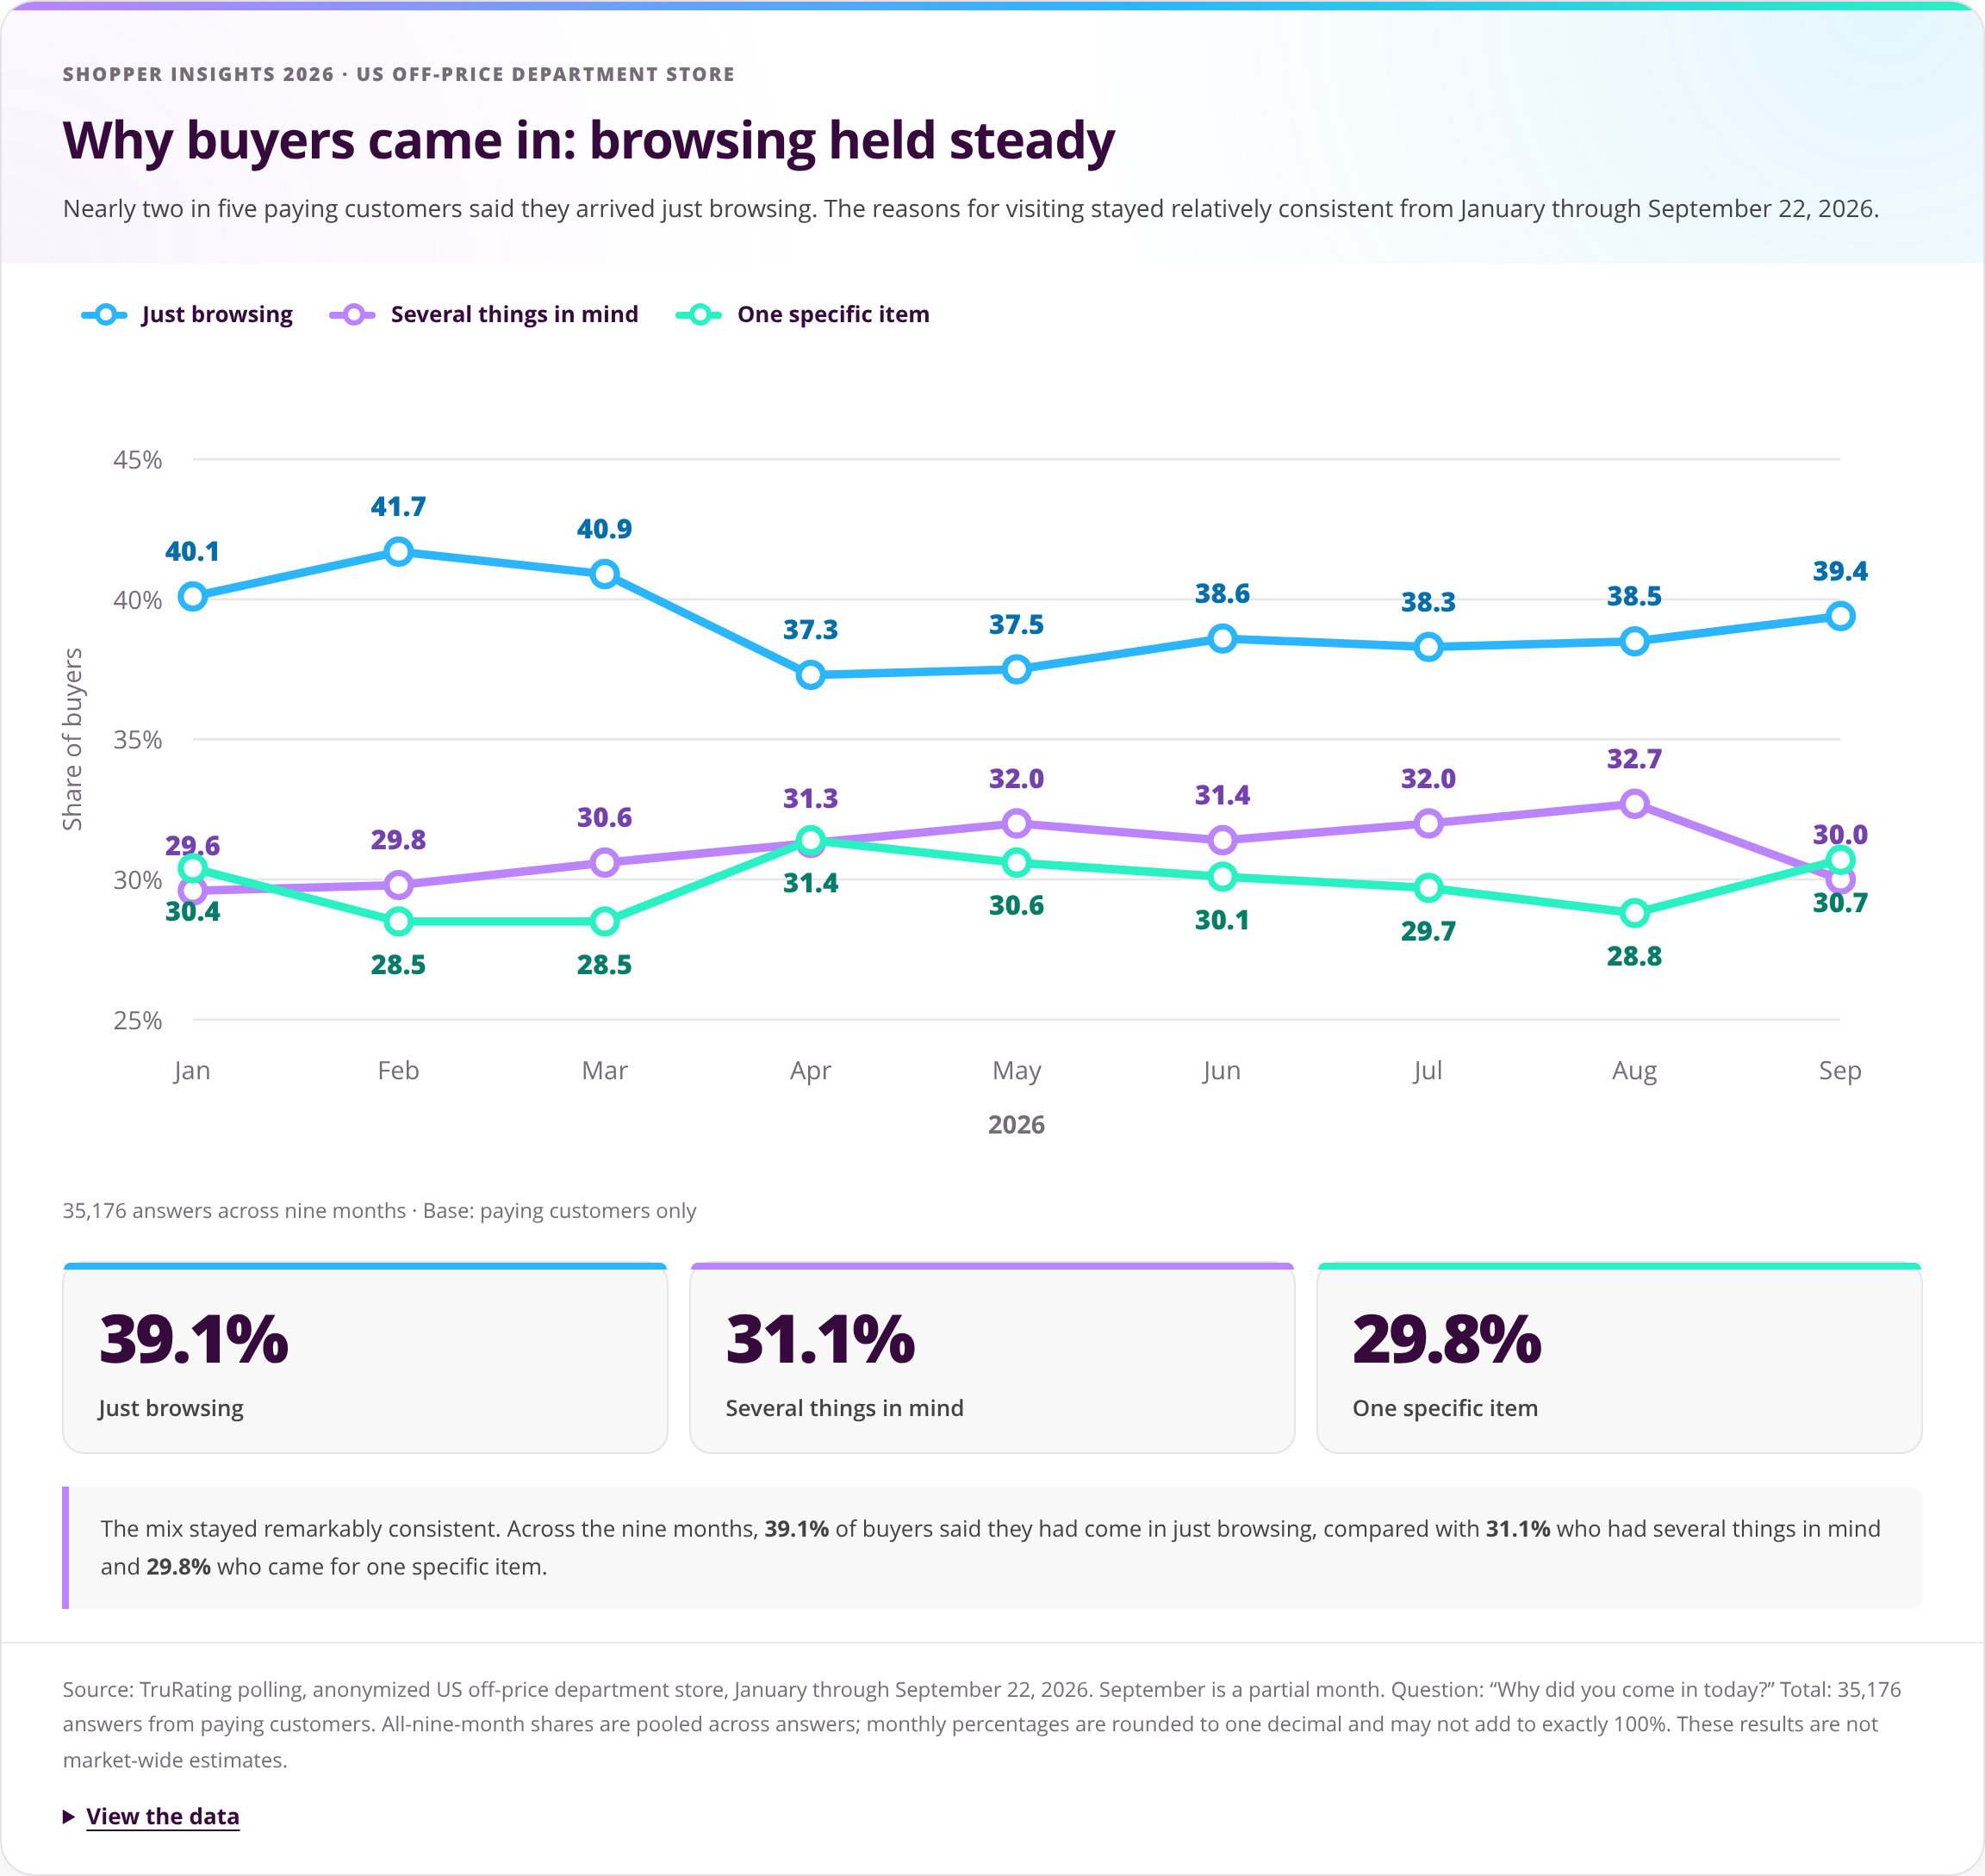
But the people who do buy are not necessarily the ones who arrived with a clear intention. At a US off-price department store, TruRating asked paying customers why they entered. From January to September 2026, between 37% and 42% of buyers said they had come in just browsing. Roughly three in ten came looking for one specific item, while another three in ten intended to buy several things. What stands out is how little these proportions changed through the year. Browsing was not simply a seasonal spike. It remained a consistent reason for visiting.
Shopper Insights 2026 · US off-price department store
Why buyers came in: browsing held steady
Nearly two in five paying customers said they arrived just browsing. The reasons for visiting stayed relatively consistent from January through September 22, 2026.
35,176 answers across nine months · Base: paying customers only
Just browsing
Several things in mind
One specific item
The mix stayed remarkably consistent. Across the nine months, 39.1% of buyers said they had come in just browsing, compared with 31.1% who had several things in mind and 29.8% who came for one specific item.
Do the math on your own door count
Consider a store where 15% of visitors make a purchase, and 30% of those buyers say they arrived for one specific item. That means approximately 4.5% of all visitors both arrived seeking a particular item and completed a purchase.
This is an illustrative calculation, not an independently measured proportion of all visitors who knew what they wanted. Some visitors who did not buy may also have arrived seeking a specific item.
Shopper Insights 2026 · Retail conversion
How many visitors came for one item and bought?
Combine your store conversion rate with the share of buyers who arrived looking for one specific item. Change the figures to see the result.
Of everyone who enters, the share who make a purchase.
Of customers who bought, the share who came seeking one item.
Estimated share of all visitors
Both came looking for one specific item and completed a purchase.
Illustrative visitors
About 45out of every 1,000 store visitors met both conditions.
15% × 30% = 4.5% of all visitors
Even at an off-price retailer, where shoppers may expect less staff involvement, a substantial share of buyers arrived without a particular product in mind.
That has implications for assisted-selling formats, where personal advice forms a larger part of the proposition. Staff who wait to be approached will largely serve shoppers who have already identified what they need. Others may benefit from help comparing products, finding the right fit or deciding whether to purchase.
“It’s not a reactive service model. It has to be much more of a proactive sales model.”
The point is not to approach everyone aggressively. It is to make useful assistance available while shoppers are still making their decisions.
Try this in your stores
Ask paying customers, “Why did you come in today?”
Compare the answers by store, format and time of day. Use the results to understand how much of your purchasing audience arrived undecided, then review whether your service model is designed to help those shoppers.
5. Six behaviors to measure in an assisted sale
Apparel retailers invest heavily in staff training, service standards and product knowledge. But knowing what associates are expected to do is different from knowing what shoppers actually experience. In our work with assisted-sale retailers, we look at six practical service behaviors that shape the shopping experience.
Shopper Insights 2026 · Retail service
Six behaviors to measure in an assisted sale
From the first greeting to an additional product suggestion, these are the actions shoppers can tell you whether they experienced.
Greet
Acknowledge the shopper.
Look available
Be visibly approachable, not simply present on the floor.
Offer help
Make assistance available before the shopper has to ask.
Listen
Understand what the shopper needs and who they are buying for.
Recommend
Suggest specific products that fit those needs.
Complete the look
Recommend useful additional items or relevant offers.
Gareth finds that stores are generally more comfortable delivering the early behaviors. Execution becomes less consistent when associates need to listen carefully, make specific recommendations or suggest additional products. Those later behaviors also create opportunities to improve transaction value.
Find the store, the hour and the behavior
One of the recurring patterns we see when we start working with retailers is the gap between their strongest and weakest stores. On some of the later service behaviors, that difference can reach 30 to 40 percentage points. That variation is not confined to different locations. Within individual stores, execution can fall by around 10 percentage points from mid-morning to mid-afternoon, before improving again toward the end of the day.
Differences between quiet and busy periods, however, are often only two to three points. Gareth’s interpretation is that workload alone explains less of the variation than store managers might expect. He points to team culture, hiring, training and the standards reinforced by store managers.
Shopper Insights 2026 · Analyst observations
Where service execution varies
Gareth Johns highlighted three differences in how consistently retail teams deliver expected service behaviors.
Across stores
30–40pp
Between stronger and weaker stores
Observed on some later service behaviors, such as recommendations and additional-item suggestions.
Through the day
~10pp
Execution can fall through the afternoon
Within individual stores, from mid-morning to mid-afternoon, before recovering later.
Quiet vs. busy
2–3pp
Difference between quieter and busier periods
A smaller gap than the differences observed between stores and across the day.
Try this in your stores
Give each store manager three pieces of information: which behavior their store delivers less consistently than comparable locations, when execution tends to slip, and which coaching actions could address the difference.
This provides a more useful starting point for coaching retail teams and targeting retail staff training. Use existing training materials to make the advice specific. Store managers are better placed to act when the problem is clearly identified.
For newly opened locations, The First 90 Days guide offers a practical framework for establishing service standards and checking how consistently they are delivered.
6. Looking for discounts doesn’t always mean finding value
At a US athletic footwear retailer, the proportion of paying customers who said they had shopped for discounts rose from 34.4% in February 2026 to 39.3% in June, an increase of 4.9 percentage points. The change was not consistent month to month. The figure dipped slightly in March before rising through June.
Shopper Insights 2026 · US athletic footwear retailer
More buyers were looking for discounts by June
The share who said they had shopped for discounts that day rose from 34.4% in February to 39.3% in June 2026. The shaded area shows the 95% confidence interval around each monthly estimate.
The increase from February to June. February had a smaller sample and a wider confidence interval. The February and June intervals overlap, although a comparison of the two proportions indicates a statistically significant difference.
What did not change
At a separate US off-price department store, two other measures of price-related attitudes remained relatively stable from January to September 2026.
Across the period, 47.6% of paying shoppers said they would splurge on a name brand. Monthly readings ranged from 46% to 51%. Another question found that 42.7% had looked for promotions, with monthly readings between 40% and 46%.
Shopper Insights 2026 · US off-price department store
Brand appetite and promotion-seeking held steady
From January through September 22, 2026, two price-related attitudes stayed within narrow monthly ranges. The markers show the share across all answers; the shaded bars show the range of monthly readings.
Brand premium
47.6%Would splurge on a name brand
28,433 answers
Monthly range46% to 51%
Promotion-seeking
42.7%Looked for promotions
29,939 answers
Monthly range40% to 46%
Both measures stayed in fairly narrow bands throughout the period. These findings come from the same off-price retailer, but from two separate questions. They should not be compared directly with discount-seeking at the athletic footwear retailer.
The promotion paradox
Our analysis of retailer data has also revealed an interesting relationship between promotions and value perception. Shoppers who bought on promotion gave lower value ratings than those who paid full price.
This is an association, not evidence that promotions caused those lower ratings. Price perception and value perception are closely related, but they are not the same thing. A shopper can recognize that an item is discounted while still questioning whether the retailer’s prices offer good value overall.
Gareth’s interpretation is that discounts can pull purchases forward or attract shoppers with different expectations of value. A shopper might secure an offer and still wonder whether a better price will appear next week. Complicated offers can help secure a sale while leaving shoppers uncertain about whether the retailer offers good value overall.
Retail price optimization needs to account for both outcomes: what a promotion contributes to sales and whether shoppers feel they received value for money. The relationship between purchasing on promotion and rating a retailer’s value is an analyst observation from client data, not a finding quantified in the chart above.
Try this in your stores
Ask shoppers whether they were looking for discounts that day, then compare their answers with what they bought and how they rated the retailer’s value. Look beyond promotional sales alone. Consider whether offers help shoppers feel they received value for money, or whether they leave them waiting for the next discount.
More from the data: the gift buyer
Not everyone buying apparel or footwear is shopping for themselves. Across a US athletic footwear retailer and an Australian apparel retailer, 26.0% of buyers said they were purchasing for somebody else between February and June 2026. That is roughly one in four purchasers.
Shopper Insights 2026 · Apparel and footwear
The gift buyer hiding in plain sight
Not every apparel or footwear purchase is for the person making it. Two participating retailers asked paying customers whether they were buying for somebody else.
Said they were purchasing for somebody else, February to June 2026.
What gift buyers need
Buying for someone else changes the conversation.
These shoppers may not know the recipient’s size or preferences. Helping them choose a suitable product can be more useful than waiting for them to find an item on their own.
A gift buyer may know the occasion but not the recipient’s size, preferences or existing wardrobe. That creates a different need for assistance. Rather than simply finding an item, the shopper may want reassurance that it is suitable. Understanding how much of a retailer’s customer base is buying for others can help with staff training, product recommendations and gift-related merchandising.
What to watch in 2027
The findings raise several questions worth following as retailers plan for the next year. Will shopping-list use continue to increase, or has it reached a more stable level? And will shoppers continue to hold on to preferences such as organic products if household budgets remain under pressure?
In apparel, it will be worth examining whether the proportion of buyers arriving just to browse remains as consistent as it was during 2026. There is also the question of promotions. The discount-seeking measure at the athletic footwear retailer ended in June, so the available data cannot tell us what happened afterward. Repeating that question would help establish whether the spring increase continued, stabilized or reversed.
What to do next
The findings suggest several practical areas to examine across grocery and apparel.
Make grocery trips easier to complete
Treat the shopping list as a useful indication of what shoppers intend to buy. Help them navigate the store, find products and identify substitutions before relying on additional promotional messages.
Pay particular attention to the products shoppers cannot easily replace. Availability of those items may matter more to completing a trip than the overall in-stock rate suggests. And look at the physical experience. Crowded aisles, replenishment activity and checkout delays can introduce friction into increasingly purposeful shopping trips.
Make service more useful in apparel
Plan for shoppers who have not decided what they want to buy. That means associates need the confidence and product knowledge to offer useful assistance, listen to what shoppers need and make relevant recommendations.
Measure how consistently those behaviors happen across stores and shifts. Focus coaching where shoppers report the greatest gaps. Promotions also need to be assessed beyond immediate sales. Understand whether shoppers who buy on an offer feel they received good value and what that means for their future purchasing decisions.
Shopper Insights 2026 · Practical questions
Three questions to ask at the register
These three questions can help retailers understand shopper intent, discount-seeking behavior, and how much of a trip was planned before the customer entered the store.
Question
“Why did you come in today?”
Helps you understand how many buyers arrived with a specific purchase in mind and how many were browsing.
Question
“Did you shop for discounts today?”
Helps you understand how actively buyers were seeking offers when they visited.
Question
“Did you use a shopping list today?”
Helps you understand how much of the grocery trip was planned before the shopper entered.
The value comes from asking consistently, comparing answers with transaction data and following up on what changes.
Watch the conversation behind the research
Simon Hay, TruRating Board Advisor and former Global CEO of dunnhumby, joined Gareth Johns, TruRating’s Chief Data Officer, to discuss selected findings from the Shopper Insights 2026 research.
Their conversation explores how purchasing decisions are changing, what retailers may be overlooking, and how customer answers can help explain what sales data alone cannot show.
In the webinar
Two perspectives on the 2026 shopper
Simon Hay and Gareth Johns bring decades of retail customer data experience to a discussion of what shoppers told us in 2026, what their purchases reveal, and the decisions retailers face as shopping habits change.

Simon Hay
TruRating Board Advisor · Former Global CEO of dunnhumby
Simon brings four decades of experience in retail customer data. As dunnhumby’s first employee, he played a foundational role in developing Tesco Clubcard and later helped build dunnhumby’s US presence through its partnership with Kroger.
Gareth Johns
Chief Data Officer · TruRating
Gareth has built his career at the intersection of customer data, retail, and commercial decision-making, including time at dunnhumby. At TruRating, he leads the analysis of what paying customers experience and how those experiences relate to purchasing behavior.
About TruRating
See the experience behind every sale. Sales data tells retailers what was bought, where, when and for how much. It does not explain what the customer experienced.
TruRating asks one anonymous question at payment and links each answer to the transaction. The volume of answers helps retailers understand what is happening store by store and shift by shift, while the transaction link connects customer experiences with spending and purchasing behavior.
TruRating collects around two million answers a week across its wider platform, working with retailers across North America, Europe and Australia and New Zealand.
It complements existing customer research by adding feedback from paying customers at the point of purchase.
Want to understand what shoppers are experiencing in your stores? Book a demo or explore TruRating for business.
Frequently asked questions about consumer trends in 2026
Answers based on TruRating’s Shopper Insights 2026 research and observations from participating retailers.
What are the biggest consumer trends in 2026?
What are the current trends in retail stores?
How have shopping habits changed?
Are shoppers trading down?
How was this research collected?
Sources and methodology
How TruRating collects the data
TruRating asks one anonymous question at the payment terminal, answered in about two seconds by someone who has just paid. The purchase is verified, and the answer is linked to the transaction.
Questions cover customer intentions, shopping preferences and experiences. Retailers are anonymized in this report. Each published chart uses data from the retailer or group identified in its source line. Results should be interpreted within that retailer’s format, market and observation period.
Research sources
Shopping lists and organic purchasing intent: TruRating polling at an anonymized European discount grocer. Shopping-list readings cover October 2025 through September 2026, with no readings in November and December 2025. The available organic series covers January to September 2026. Monthly answer volumes vary by question and period.
Reason for visit: TruRating polling at an anonymized US off-price department store, January to September 22, 2026. Question: “Why did you come in today?” Only paying customers are included. The share who reported just browsing ranged from 37.3% to 41.7% across the nine months.
Discount-seeking: TruRating polling at an anonymized US athletic footwear retailer, February to June 2026. Question: “Did you shop for discounts today?” Monthly samples range from 678 to 2,917 answers. Confidence intervals use a 95% normal approximation.
Brand premium and promotion-seeking: TruRating polling at an anonymized US off-price department store, January to September 2026. The two questions have different samples and are analyzed separately.
Gift purchasing: TruRating polling across an anonymized US athletic footwear retailer and an Australian apparel retailer, February to June 2026. Across the two participating retailers, 26.0% of buyers said they were purchasing for somebody else.
US inflation: Bureau of Labor Statistics, Consumer Price Index release, October 14, 2026 . Food-at-home and apparel figures show 12-month changes to September 2026.
Analyst observations
Some findings in this report come from TruRating client analysis and observations shared by Gareth Johns during the Shopper Insights 2026 webinar, rather than the polling series presented in the charts.
These include changes in grocery trip frequency, grocery-app preferences, signs of increased cooking from scratch, relationships between store friction and return visits, customer-density effects, variation in staff behavior and differences in value perception between promotion and full-price buyers.
These observations are not independently published research datasets and should not be interpreted as evidence of causation. Quotes from the webinar have been lightly edited for clarity.