

Learning how to increase survey response rates starts with reducing the effort required to answer. Survey length, timing, and channel usually matter more than cosmetic changes such as subject lines or incentives. And the right fix depends on whether customers are ignoring the invitation, lowering your survey participation rate, or abandoning the survey after they start.
The fastest ways to increase survey response rates are to shorten the survey, ask at the moment of the experience, and use a channel that requires fewer additional steps. Timing and channel will often have more impact than incentives, reminders, or invitation copy.
This article ranks 12 tactics by their likely impact. The hierarchy is a practical framework rather than a universal formula. Results will vary by audience, survey purpose, and channel.
Survey response rate vs. survey completion rate
A low survey response rate means too few invited customers complete the survey.
A low survey completion rate means people start the survey but leave before reaching the end.
For this article, we use the following definitions:
- Survey response rate: Completed surveys divided by eligible survey invitations.
- Survey participation rate: Survey starts divided by eligible invitations.
- Survey completion rate: Completed surveys divided by survey starts.
- Survey abandonment rate: Unfinished surveys divided by survey starts.
- Response volume: The total number of completed responses.
- Representativeness: How closely respondents reflect the wider customer group you want to understand.
The distinction matters as a better subject line may encourage more people to start an email survey, but do nothing to improve completion. A shorter survey may increase completion without fixing a poorly timed invitation.
How we ranked the tactics
The tactics are ranked according to the type of friction they remove:
- High-impact tactics change the survey’s structure, timing, or channel
- Medium-impact tactics improve the experience after someone begins
- Low-impact tactics improve how the survey is presented or promoted
Low impact does not mean ineffective. It means the tactic is unlikely to compensate for a survey that is too long, arrives too late, or requires too much effort.
| Likely impact | Tactic | Main problem addressed |
|---|---|---|
| High | Reduce the survey to one question or under two minutes | Completion and abandonment |
| High | Ask during or immediately after the experience | Recall and participation |
| High | Use the channel where the customer already is | Participation and response |
| High | Set survey frequency caps | Fatigue and nonresponse |
| Medium | Design for mobile first | Completion |
| Medium | Show clear progress | Abandonment |
| Medium | Remove logins and repeated data entry | Participation and completion |
| Medium | Improve question order and survey logic | Completion and data quality |
| Low | Improve the subject line | Opens and participation |
| Low | Use incentives carefully | Participation |
| Low | Send limited reminders | Nonresponse |
| Low | Use a recognized sender | Trust and opens |
Why is your survey response rate low?
Low survey response rates normally come from one of three problems.
First, the customer may never notice or open the invitation. This points to the channel, sender, subject line, or timing.
Second, the customer may see the survey but decide it is not worth the effort. This often happens when the purpose is unclear, the survey looks long, or the experience is no longer fresh in their mind.
Third, the customer may start but not finish. Survey abandonment is commonly caused by excessive length, poor mobile design, repetitive questions, irrelevant sections, or unnecessary personal data requests.
Repeated requests can make the problem worse. When CX, marketing, product, and research teams run separate programs, the same customer may receive several surveys within a short period. Even well-designed surveys become easier to ignore when they arrive too often.
Response rate should not be treated as the only sign of data quality. Research into survey validity warns against using one benchmark number as proof that a sample is appropriate or representative. Response rate needs to be considered alongside who responded, who did not, and whether important customer groups are missing.
High-impact tactics: fix the survey structure
These changes remove the biggest barriers to survey participation and completion.
1. Cut the survey to one question or keep it under two minutes
Takeaway: Ask only what you are prepared to act on.
Survey completion generally falls as more questions and steps are added. An analysis of more than 8,000 surveys found that two- to three-question micro-surveys had a median completion rate of 86.8%. Within comparable survey formats, completion declined consistently as surveys became longer.
For transactional feedback, consider asking one question per interaction. Rotate the question across different transactions to build a broader data set over time.
Where several questions are essential, set a strict time limit. Customer surveys lasting more than seven or eight minutes have been associated with increases in abandonment and completion-rate declines of between 5% and 20%. Customer-facing surveys also showed less tolerance for length than work- or education-related surveys in the same data set.
Remove any question that is merely interesting. Every question should support a decision, test, or action.
2. Ask in the moment, not days later
Takeaway: Collect feedback while the experience is still clear.
Survey timing affects the amount of effort required from the customer. A request made during or immediately after an interaction does not ask them to reconstruct an experience from memory several days later.
In retail, this could mean asking at the point of payment. For a digital product, it could mean an in-app survey after a task is completed. For an appointment or delivery, it may be an SMS sent as soon as the interaction ends.
In-the-moment feedback also gives the response clearer operational context. It is easier to connect the answer to the relevant store, visit, transaction, or stage of the customer journey.
The best timing will depend on the question. Ask about checkout immediately. Ask about product durability later. The aim is not to ask everything at once, but to ask each question at the point when the customer can answer it accurately.
3. Pick the channel where the customer already is
Takeaway: Reduce the number of steps between the experience and the answer.
An email survey may require the customer to notice the message, open it, click a link, wait for a page to load, and then begin. Each step creates another drop-off point.
Choose a survey channel that fits the interaction:
- Use point-of-sale feedback for an in-store transaction.
- Use an in-app survey for a digital journey.
- Use SMS for a recent service or delivery.
- Use an email survey when the topic genuinely requires more reflection.
- Use a website micro-survey for feedback about a specific page or task.
Do not assume that one channel will work equally well for every customer or use case. Compare survey participation and completion by channel rather than relying on one overall rate.
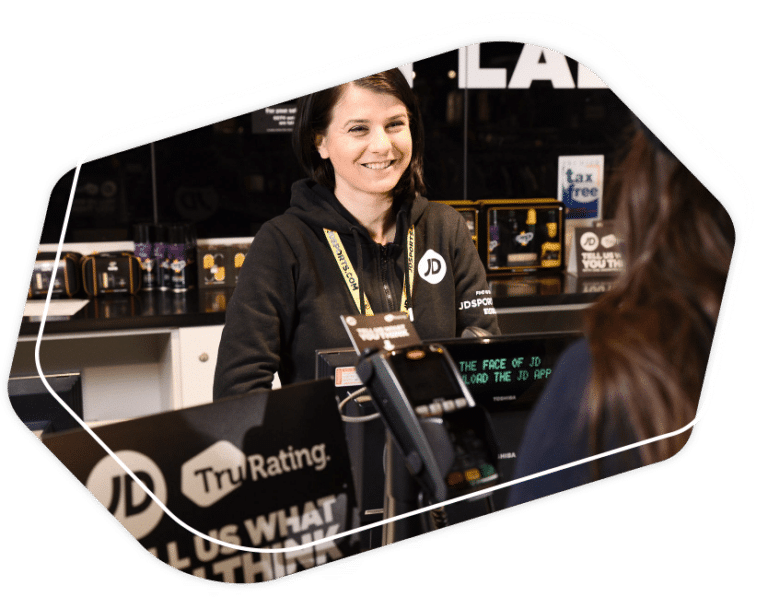
In practice: TruRating asks one question as part of the checkout journey. On average this achieves response rates of 84% in-store and 43% online. This is not a controlled comparison against every delayed survey method, but it shows what a short, in-the-moment model can achieve when feedback is built into an interaction the customer is already completing.
See how point-of-sale feedback works
4. Set survey frequency caps
Takeaway: Protect the customer from overlapping feedback requests.
Surveying fewer people does not automatically mean collecting better data. But limiting how often the same customer is contacted can protect future participation.
Set frequency rules across CX, marketing, research, product, and service teams. A customer should not receive separate satisfaction, loyalty, and delivery surveys within a few days because each program has a different owner.
Frequency caps may include:
- A minimum period between survey invitations
- A maximum number of requests per quarter
- Suppression after a customer has recently responded
- Separate rules for transactional and relationship surveys
- Priority rules when several teams want to contact the same person
This reduces survey fatigue without forcing the business to stop collecting feedback. You can still gather high response volume by asking brief questions across a broad customer base.
Medium-impact tactics: improve the respondent experience
These tactics help once someone has chosen to begin the survey.
5. Design for mobile first
Takeaway: Build the survey for the smallest screen customers are likely to use.
A mobile-optimized survey should not be a compressed desktop form.
Avoid large matrix questions, small buttons, horizontal scrolling, and long open-text fields. Keep answer options easy to tap, and make sure the customer can understand the question without zooming or moving across the screen.
Test the survey on real devices before launch. Check page speed, text size, button spacing, and whether the keyboard blocks important content.
Mobile performance should also be measured separately. A strong desktop completion rate can hide significant mobile abandonment.
6. Use an accurate progress indicator
Takeaway: Tell respondents how much work remains.
A progress bar or “Question 2 of 4” message reduces uncertainty in a multistep survey. It reassures customers that the task has a clear end.
But it must be accurate. A progress bar that barely moves, jumps backward, or ignores conditional questions can make the survey feel longer.
For a single-question survey, no progress bar is needed. For short surveys, a simple question count is often clearer than a percentage.
7. Remove forced logins and unnecessary data entry
Takeaway: Do not make customers prove who they are before they can respond.
Account creation, password entry, and repeated requests for information already held by the business create avoidable friction.
Where possible, pass existing details into the survey automatically. Do not ask the customer to reenter their store, order number, purchase date, or contact information when that data is already available.
Only collect personal data that is necessary for the survey’s purpose. Explain whether the response is anonymous, how it will be used, and whether the customer may be contacted.
Trust affects both participation and answer quality.
8. Put easy and relevant questions first
Takeaway: Build momentum before asking for more effort.
Start with a simple question linked directly to the recent experience. Do not begin with demographic questions, lengthy instructions, or a large comment box.
Use branching logic to remove irrelevant questions. A customer who did not speak to an employee should not be asked to rate that employee’s knowledge. Someone who did not use a loyalty offer should not have to answer several questions about it.
Place optional comments, personal questions, and classifications near the end.
Then inspect question-level drop-off. If a large number of respondents leave at the same point, the problem may be the wording, sensitivity, or effort required by that question.
Low-impact tactics: improve the packaging
These changes can improve results, but only after the main sources of friction have been addressed.
9. Make the subject line specific
Takeaway: Tell the customer what the survey covers and how long it takes.
“Two questions about today’s delivery” is clearer than “We value your feedback.”
Specific subject lines set an honest expectation. Avoid claiming a survey will take “a few seconds” when it contains several pages.
Test subject lines against survey starts and completed responses, not opens alone. A subject line can increase clicks while attracting people who abandon the survey once they see the actual length.
10. Use incentives carefully
Takeaway: Incentives may increase participation, but they can also change who responds.
Incentives can be useful for longer research, specialist audiences, or surveys that require significant effort. Experimental and field research has found that incentives and follow-up can increase response in some settings. The size of the effect depends on the audience, survey method, and incentive design.
But a higher response rate does not automatically mean better responses. Some participants may rush, provide low-effort answers, or join mainly for the reward.
Monitor:
- Completion time
- Duplicate entries
- Repeated answer patterns
- Poor-quality open-text responses
- Differences between incentivized and nonincentivized groups
For a one-question transactional survey, removing friction may cost less and produce cleaner data than adding a reward.
11. Send one or two well-timed reminders
Takeaway: Recover missed invitations without creating more fatigue.
A reminder can help when a customer intended to respond but missed the original request.
Send one reminder after a reasonable interval. A second may be justified for important research with a fixed closing date, but daily messages are likely to create annoyance.
Stop all reminders as soon as someone responds. Coordinate reminder cadence with other customer communications so survey invitations do not compete with service updates, marketing emails, or account notices.
12. Use a sender the customer recognizes
Takeaway: Make it clear who is asking and why.
A survey from the store, brand, or service the customer recently used is easier to trust than a generic research address.
Use a recognizable sender name and explain the purpose in one sentence:
“We are reviewing our new checkout process and would like to know whether it was easy to use.”
This small change can improve relevance and trust. But it remains a packaging tactic. A familiar sender will not rescue a long or badly timed survey.
How to measure improvement
To understand how to increase response rates, establish a baseline before making changes.
Track the full survey journey:
| Metric | Calculation | What it tells you |
| Survey response rate | Completed surveys ÷ eligible invitations | Whether the whole program generates responses |
| Survey participation rate | Survey starts ÷ eligible invitations | Whether people are willing to begin |
| Survey completion rate | Completed surveys ÷ survey starts | Whether the survey holds attention |
| Survey abandonment rate | Unfinished surveys ÷ survey starts | How often people leave |
| Question drop-off | Responses at each question ÷ survey starts | Where friction appears |
| Median completion time | Middle completion time across respondents | How much effort the survey requires |
Test major changes before minor ones. For example:
- Reduce the survey from 10 questions to three.
- Move it closer to the experience.
- Compare two different channels.
- Improve the mobile journey.
- Test subject lines, reminders, or sender names.
Change one major variable at a time where possible. Otherwise, you may improve results without knowing which change caused the increase.
Break performance down by device, channel, location, and customer group. Overall averages can hide poor results in an important segment.
What a high-response feedback model looks like
A strong feedback model makes responding easier than ignoring the question. The request is short. It appears at the right moment. It fits the channel. It does not require a login. And it has a clear operational purpose.
TruRating applies this model by asking one rotating question at checkout. Customers answer with a single tap as part of the payment journey. TruRating reports 84% in-store response rates and more than 43% online, with each response connected to transaction data.
The value is not only the size of the response base.
Traditional delayed surveys may leave CX teams relying on a relatively small, self-selecting group. This can make it difficult to separate a local issue from a broader pattern or understand whether a problem belongs to one store, shift, or customer journey.
Higher-volume, transaction-linked feedback gives CX and operations teams an earlier signal. They can see where the experience is changing, identify specific locations or dayparts that need attention, and connect customer responses to business measures such as spend.
That moves feedback beyond reporting.
It can help teams detect experience risk before it becomes a repeated complaint, validate whether a new initiative is working, and give field leaders clearer information for coaching. The goal is not simply to increase survey response rates. It is to hear from enough everyday customers to make better decisions with confidence.
Ready to hear from more customers at the moment that matters? See how TruRating’s in-store feedback works.
Useful resources
- Real-time feedback and customer experience
- How to measure customer service
- How the vocal minority distort customer feedback
- The limitations of traditional customer feedback methods
Frequently asked questions
Answers to common questions about improving survey response rates.