

There is no single good survey response rate for every survey. The latest digital benchmark data places the overall median at around 10%, but results change sharply by channel. Ecommerce email surveys averaged 3.24% in Retently’s large 2025 dataset, while mobile surveys recorded a median of 18.69% in Survicate’s survey response rate benchmarks.
TruRating’s single-question payment-terminal surveys average an 84% response rate.
Direct answer: A response rate close to 10% is typical across many digital customer surveys. But a good result must be judged against the same channel and method. A 10% rate could be strong for email, ordinary for a web survey and low for an in-app or point-of-sale survey.
This article uses the latest available data for 2026 planning. Most external figures come from surveys conducted during 2025, while the point-of-sale figure is based on current TruRating network data.
How to calculate survey response rate
To understand how to calculate survey response rate, divide the number of valid responses by the number of eligible people invited or shown the survey. Then multiply the result by 100.
Survey response rate = (valid responses ÷ eligible survey invitations) × 100
For example, a business sends 5,000 eligible survey invitations and receives 400 valid responses:
(400 ÷ 5,000) × 100 = 8%
The survey response rate is 8%.
The denominator needs to be clearly defined. Depending on the survey method, it may include:
- Emails successfully delivered
- Customers shown an in-app prompt
- Eligible callers contacted
- Transactions where a question appeared
- Website visitors who saw an intercept
Remove invalid email addresses, technical failures and ineligible participants where the methodology allows it. The American Association for Public Opinion Research publishes standard definitions for handling complete responses, partial responses and cases where eligibility is unknown.
Response rate vs completion rate
Response rate vs completion rate is an important distinction. Response rate measures participation across the eligible audience. Completion rate measures how many people who started the survey reached the end.
For example:
- 1,000 people see a survey.
- 100 begin it.
- 80 complete it.
The participation or start rate is 10%. The completion rate is 80%.
Survey platforms do not always use these terms in the same way. Survicate counts a response when someone starts a survey or clicks its welcome screen. It then calculates response rate as responses divided by survey views.
Refiner’s 2025 in-app survey study also reports response and completion as separate measures. It recorded a 27.52% average response rate and a 24.84% average completion rate.
Always check the definition before comparing your survey response percentage with another company’s benchmark.
Average survey response rates by channel in 2026
The average survey response rate varies more by collection method than it does by survey topic. But benchmark reports also use different denominators, definitions and audiences.
The table below shows the latest evidence available for 2026 planning. It should not be treated as a like-for-like platform comparison.
Table: Latest survey response rate benchmarks for 2026 planning
| Survey channel | Observed response rate | Dataset and measurement basis | Data year |
|---|---|---|---|
| Ecommerce email | 3.24% average | Retently analysis of more than 25 million ecommerce survey invitations. | 2025 |
| Mobile survey | 18.69% median | Survicate analysis of 1,025 mobile surveys. Responses were divided by survey views. | 2025 |
| Website widget | 7.64% median | Survicate analysis of 3,095 widget surveys. | 2025 |
| Intercom survey | 5.41% median | Survicate analysis of 212 surveys delivered through Intercom. | 2025 |
| In-app survey | 27.52% average | Refiner analysis of 1,382 in-app surveys generating more than 50 million views. | 2025 |
| Ecommerce in-app | 32.34% average | Retently ecommerce dataset. Prompts appeared while customers were active in the experience. | 2025 |
| Point-of-sale survey | 84% average | TruRating network benchmark. One anonymous question is presented during payment. | Current benchmark |
Retently recorded a tenfold difference between ecommerce email and in-app surveys: 3.24% compared with 32.34%.
Survicate also found that mobile surveys outperformed website widgets and surveys delivered through Intercom.
These differences show why channel matters. Email can reach a large audience but asks customers to switch attention after the experience. In-app and point-of-sale questions appear while the customer is already engaged.
How to read the benchmarks
The figures should not be averaged into one universal number.
Retently reports averages from ecommerce accounts. Survicate reports median survey-level results across several industries. Refiner only included in-app surveys with at least 100 views and 50 responses.
TruRating measures participation among paying customers presented with a one-question prompt during checkout.
The table is therefore most useful for comparing:
- Email surveys with other email surveys
- Mobile surveys with other mobile surveys
- Payment-terminal feedback with comparable checkout feedback
- Your performance over time using one consistent definition
What about SMS, phone and kiosk survey response rates?
A universal SMS survey response rate is difficult to establish because reports often measure different actions, including link clicks, direct replies, survey starts and completed forms.
Phone data is also hard to compare. Published benchmarks often come from public polling rather than customer satisfaction programs, with different callback and eligibility rules.
Feedback kiosks present a different problem: many record response volume without a reliable denominator. A kiosk may receive 1,000 responses, but the business may not know how many eligible customers saw it.
For these channels, track the full participation funnel and build an internal benchmark using the same audience, survey and measurement method.
What is a good response rate for a survey?
So, what is a good response rate for a survey? A good rate is one that performs well against the same channel, reaches enough of the target population and provides enough responses for the decision being made.
Based on the strongest available benchmarks:
- Around 10% is close to the overall median for digital surveys in Survicate’s dataset.
- Around 3% may be normal for high-volume ecommerce email, based on Retently’s research.
- Around 19% is typical for mobile surveys in Survicate’s dataset.
- Around 28% was the average for qualifying in-app surveys in Refiner’s dataset.
- TruRating averages 84% when one anonymous question is included in the payment process.
Survicate’s middle 50% of survey results ranged from 3.75% to 21.69%. This broad spread is another reason not to rely on a single normal survey response rate across every method.
A better benchmarking process compares four things:
- Channel: Was the survey sent by email, shown in-app or presented during payment?
- Audience: Was it sent to every customer, loyal customers or a self-selected group?
- Timing: Was the question asked during the experience or several days later?
- Decision level: Do you need a brand-wide trend or reliable store-level results?
What sample size makes a survey statistically reliable?
A statistically valid survey response rate is not a fixed percentage. Statistical reliability depends on sample size, sampling method, margin of error and how well respondents reflect the wider population.
According to SurveyMonkey’s sample-size calculator, approximately 384 completed responses produces a margin of error of around ±5 percentage points at a 95% confidence level for a large population. This assumes simple random sampling, a 50/50 response distribution and no additional design effect.
Approximate sample sizes for a large population are:
| Completed responses | Approximate margin of error at 95% confidence |
|---|---|
| 96 | ±10 percentage points |
| 384 | ±5 percentage points |
| 600 | ±4 percentage points |
| 1,067 | ±3 percentage points |
| 2,401 | ±2 percentage points |
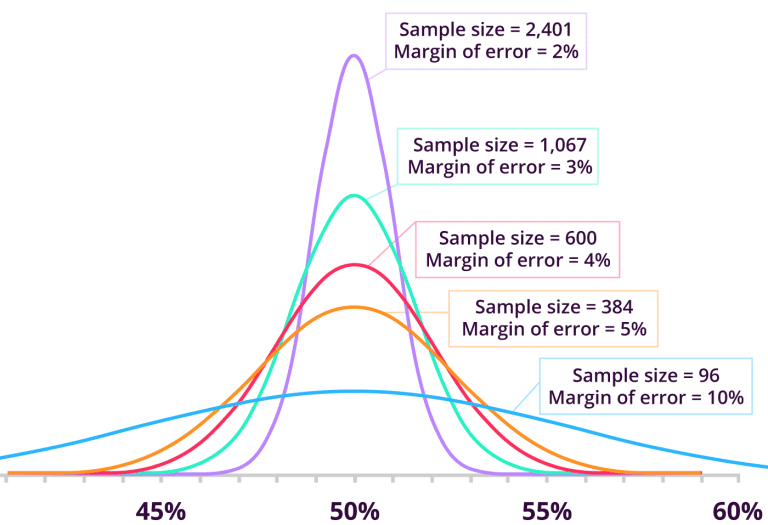
How survey sample size affects margin of error. Approximate figures assume a large population, a 95% confidence level, a 50/50 response distribution and simple random sampling.
Why a larger sample produces a smaller margin of error
The chart shows how survey precision improves as the number of completed responses increases. With around 96 responses, the margin of error is approximately ±10 percentage points. Increasing the sample to around 384 reduces it to ±5 points, while 2,401 responses brings it close to ±2 points.
This does not mean every business needs thousands of responses. The right customer satisfaction survey sample size depends on the decision being made.
A brand-level trend may be useful with a few hundred representative responses. But a retailer trying to compare individual stores, shifts or customer segments needs enough responses within each group. A large total sample can still provide little practical insight if it is spread too thinly across hundreds of locations.
The chart also shows why sample size and response rate should not be treated as the same thing. Sample size affects the precision of the result. Response rate shows how much of the eligible audience participated and can help identify possible nonresponse risk.
Methodology note: These figures are estimates for a large population at a 95% confidence level and assume simple random sampling with maximum variability. Real-world precision may differ where responses are clustered, weighted or self-selected.
Sample size does not prove representativeness
A survey can collect thousands of responses and still be biased if the people who respond differ from those who remain silent.
Pew Research Center’s research into low survey response rates found that lower response can create meaningful bias for some measures but not others. Response rate alone is therefore not a complete measure of survey quality.
Suppose two retailers each receive 400 completed responses:
- Retailer A invited 800 randomly selected customers and received a 50% response rate.
- Retailer B invited 40,000 customers and received a 1% response rate.
Both have the same completed sample size. But Retailer B may face greater nonresponse risk if the 1% who answered differ meaningfully from the wider customer base.
The reverse is also possible. A low response rate does not automatically invalidate a survey if the final sample is appropriately selected, weighted and checked for bias.
Brand-level data may not support store-level decisions
A customer satisfaction survey may have enough responses for a company-wide result but too few for individual stores, shifts or regions.
For example, 1,000 responses across 500 stores averages only two responses per store. The total looks substantial, but it cannot provide stable daily store-level insight.
Before collecting feedback, decide the level at which teams need to act:
- Brand
- Country
- Region
- Store
- Department
- Shift or daypart
- Customer segment
The more granular the decision, the more responses are needed within each group.
Response rate benchmarks by survey type
The typical survey response rate also changes according to the question being asked. Recent transactional questions usually require less thought than broader relationship questions.
Promoter score survey response rate
The promoter score survey response rate was 4.5% in Retently’s 2025 ecommerce dataset.
By comparison, Refiner recorded a 21.71% response rate for in-app NPS surveys.
The difference is largely about collection method. A promoter score question sent by email competes for attention in an inbox. An in-app question appears while the customer is already engaged with the product or service.
CSAT response rate
The CSAT response rate was 9.76% in Retently’s ecommerce study.
Refiner recorded a 26.29% response rate for in-app CSAT surveys.
CSAT often performs better than a promoter score because it asks customers to evaluate a recent, specific experience rather than reflect on the whole relationship.
Customer effort survey response rate
Customer effort score surveys recorded the highest response rate in Retently’s comparison, at 22.54%.
Questions such as “How easy was it to complete your purchase?” can be answered quickly because they refer to a clear and recent task.
Post-purchase survey response rates
Post-purchase results depend heavily on timing. An email sent several days later may perform close to the email benchmark. A one-question prompt shown during checkout can produce a much higher response rate.
When comparing post-purchase surveys, separate:
- Receipt links
- Follow-up email
- SMS
- Online checkout questions
- Payment-terminal questions
- Self-selected QR codes
These methods do not measure participation in the same way.
Survey response rate benchmarks by industry
Survey response rates by industry vary because customer relationships, purchase frequency and survey placement differ.
The following results come from Survicate’s 2025 benchmark of 4,332 surveys from 460 companies.
| Industry | Median response rate |
|---|---|
| Fintech | 20.11% |
| Agency and consulting | 15.01% |
| Education | 14.69% |
| Retail and wholesale | 14.44% |
| Financial services | 12.82% |
| Digital marketplaces | 11.72% |
| Healthcare providers | 10.54% |
| SaaS | 7.74% |
| Manufacturing | 5.90% |
| Media | 5.37% |
Retail survey response rates
Retail and wholesale surveys had a median response rate of 14.44% in Survicate’s dataset.
This should not be treated as a universal retail benchmark. It combines surveys delivered through Survicate’s supported formats. It does not represent receipt surveys, payment-terminal feedback or every retail category.
Retailers should build separate benchmarks for in-store feedback, online checkout, email, loyalty members and post-delivery surveys.
Patient satisfaction survey response rates
The median patient satisfaction survey response rate for healthcare providers was 10.54% in Survicate’s data.
Healthcare organizations should also account for survey method, patient demographics and accessibility. A patient portal survey, mailed questionnaire and telephone follow-up will produce different participation patterns.
B2B survey response rates
The median B2B survey response rate was 8.18%, compared with 12.85% for B2C surveys in Survicate’s dataset.
B2B audiences are often smaller and contain several people involved in the same account. The relevance and seniority of each response may therefore matter more than achieving the highest possible percentage.
Hospitality survey response rates
There is no robust universal hospitality benchmark comparing email, post-stay links, apps, kiosks and in-person prompts using one definition.
Hospitality businesses should compare results by collection method and guest journey stage. A post-stay email should be judged against email performance, while an in-app or on-property question should be compared with other in-flow surveys.
Do customer surveys still work?
Yes, customer surveys still work when they ask a relevant question at the right moment and lead to a clear decision.
They work less well when every customer receives the same long questionnaire after a delay. They also lose value when the result is limited to a top-line score that teams cannot connect with a location, process or customer-facing behavior.
Effective customer surveys can help a business:
- Detect emerging experience problems
- Test a new checkout or service model
- Compare execution across locations
- Understand why results differ between stores
- Track whether coaching or training is changing behavior
- Identify customer friction before it appears in complaints or sales performance
The goal is not to collect the largest possible number of answers. It is to collect enough timely and relevant feedback to support the decision being made.
How to analyze customer satisfaction survey data
Once you have enough responses, the next step is turning the data into something teams can use.
Start by removing duplicate, invalid or technically incomplete responses. Then separate quantitative results, such as CSAT, promoter scores and customer effort scores, from qualitative comments that explain why customers gave those scores.
For retailers, the analysis should go beyond one company-wide average. Break results down by store, region, channel, customer segment or daypart where the sample size allows it. This can reveal whether a problem is widespread or limited to a particular location or operating period.
The most useful analysis also connects customer feedback with operational or commercial data. Comparing feedback with transaction value, conversion or the execution of specific service behaviors can help teams understand what is influencing performance, rather than simply showing whether satisfaction moved up or down.
See our guide to customer experience analytics for more on turning customer data into practical insight.
Why survey response rates keep falling
The average survey return rate is under pressure because customers receive more requests through increasingly crowded channels.
Retently’s analysis of more than 25 million ecommerce survey invitations found that email response rates fell from 4.09% in the first quarter of 2025 to 2.50% in the fourth quarter. Survey volume almost doubled during Q4, while the overall response rate fell.
Several factors contribute to lower response rates:
- Survey fatigue: Customers are asked for feedback by retailers, apps, delivery companies and service providers.
- Inbox saturation: Email surveys compete with promotions, receipts and delivery notifications.
- Poor timing: The experience is no longer fresh when the request arrives.
- High effort: Long or repetitive surveys require too much time.
- Low trust: Customers may not recognize the sender or believe their feedback will be used.
- Over-contacting: Sending more surveys can reduce participation rather than increase it.
Email still has value for reach and relationship tracking. But in-flow surveys have a structural advantage because they appear while the customer’s attention is already focused on the experience.
How to improve your survey response rate
To improve customer satisfaction survey response rates, reduce the effort required and ask closer to the experience.
The main actions are:
- Keep the survey focused.
- Use the channel that best matches the customer moment.
- Trigger transactional questions soon after the event.
- Control how frequently each customer is contacted.
- Make the survey invitation visible and easy to understand.
- Explain why the feedback matters.
- Track which customer groups are missing from the sample.
- Use one consistent definition when monitoring performance.
Survicate’s response-rate benchmark found that surveys with two or three questions had a median response rate of 15.97%, compared with 6.87% for surveys with seven or more questions.
What are the best customer satisfaction survey questions?
The best questions are clear, specific and connected to a recent experience.
Examples include:
- How satisfied were you with your experience today?
- Was it easy to find what you needed?
- Did a member of staff offer helpful advice?
- How easy was it to complete your purchase?
- How likely are you to recommend us?
- What is one thing we could improve?
Broad questions are useful for relationship tracking. Specific questions are better when the business needs to diagnose an operational issue or test whether a new process is working.
How often should you survey customers?
Survey frequency should reflect how often customers interact with the business and what the organization needs to learn.
Post-purchase questions should be asked during or soon after the transaction, while the experience is fresh. Broader relationship surveys may only be needed quarterly or twice a year.
Continuous feedback can support daily operational decisions, but questions should rotate and contact frequency should be controlled to avoid survey fatigue.
The goal is not to ask every customer every question. It is to collect enough responses on each topic to identify reliable patterns without creating unnecessary effort.
From response rate to decision-ready customer signal
A higher response rate gives businesses more opportunities to hear from everyday customers, not only the people motivated enough to find and complete a separate survey.
But volume is only one part of the picture. CX and Store Operations leaders also need feedback that helps them detect experience risk early, compare execution across locations and understand where teams should act.
TruRating captures one anonymous response during payment from an average of 84% of customers. The question rotates, requires one keypress and is linked to the relevant transaction.
This gives retailers a high-volume customer signal that can be analyzed by store, region, shift and transaction context.
For CX teams, that reduces reliance on a small, self-selecting group of respondents. For operations teams, it provides more regular evidence of where customer-facing execution is working and where it is beginning to slip.
The aim is not simply to report a better survey response rate. It is to collect feedback at enough scale, speed and detail to support better decisions.
Learn more about our point-of-sale feedback solution.
Useful resources
- How to increase survey response rate
- Real-time feedback and customer experience
- How to measure customer service
- How the vocal minority distort customer feedback
- The limitations of traditional customer feedback methods
Frequently asked questions
What is a good survey response rate?
A good survey response rate depends on the channel. Around 10% is close to the overall median in recent digital survey data. Ecommerce email surveys may average closer to 3%, while mobile and in-app surveys can exceed 20%. Point-of-sale questions can perform considerably higher when they are built into the payment experience.
Is a 10% survey response rate good?
A 10% survey response rate is good for many email, web and B2B surveys. It is close to Survicate’s overall median of 9.98%. But it would be below current benchmarks for many mobile, in-app and payment-terminal surveys.
What is the average promoter score survey response rate?
The average promoter score survey response rate depends on how the question is delivered. Retently recorded 4.5% across its ecommerce dataset, while Refiner recorded 21.71% for in-app promoter score surveys.
How do you calculate a survey response rate?
Divide the number of valid responses by the number of eligible survey invitations or views. Multiply the result by 100. For example, 200 valid responses from 2,000 eligible invitations gives a 10% response rate.
What response rate do you need for statistical significance?
There is no response-rate threshold that creates statistical significance. The reliability of survey estimates depends on sample size, sampling method, margin of error and how well respondents represent the target population.
For a large population, approximately 384 randomly selected responses gives a margin of error of around ±5 percentage points at a 95% confidence level under standard assumptions. You can check different population and confidence settings using SurveyMonkey’s sample-size calculator.
Sources and methodology
The figures in this article use the latest available datasets for 2026 planning:
- Retently: More than 25 million ecommerce survey invitations sent during 2025. The study reports average response rates by channel and survey type.
- Survicate: 4,332 surveys from 460 companies. Response rate is calculated as survey starts divided by survey views. Results are reported as medians.
- Refiner: 1,382 qualifying in-app surveys, generating more than 50 million views. Results are reported as averages.
- TruRating: Current network benchmark based on customers responding to one anonymous question presented during payment.
- AAPOR: Standard survey response-rate definitions and methodological guidance.
- SurveyMonkey: Sample-size, confidence-level and margin-of-error guidance.
- Pew Research Center: Research into the relationship between low response rates and nonresponse bias.
Because each provider uses a different audience and measurement method, figures should be compared within the same channel rather than combined into one universal average.
Confidence intervals are an important concept here. They are a mathematical technique used to understand how size can impact accuracy. While the advanced stuff can be hard to grasp, at a top level, it’s simple. The more data you collect, the better your chances are of getting a representative sample.