
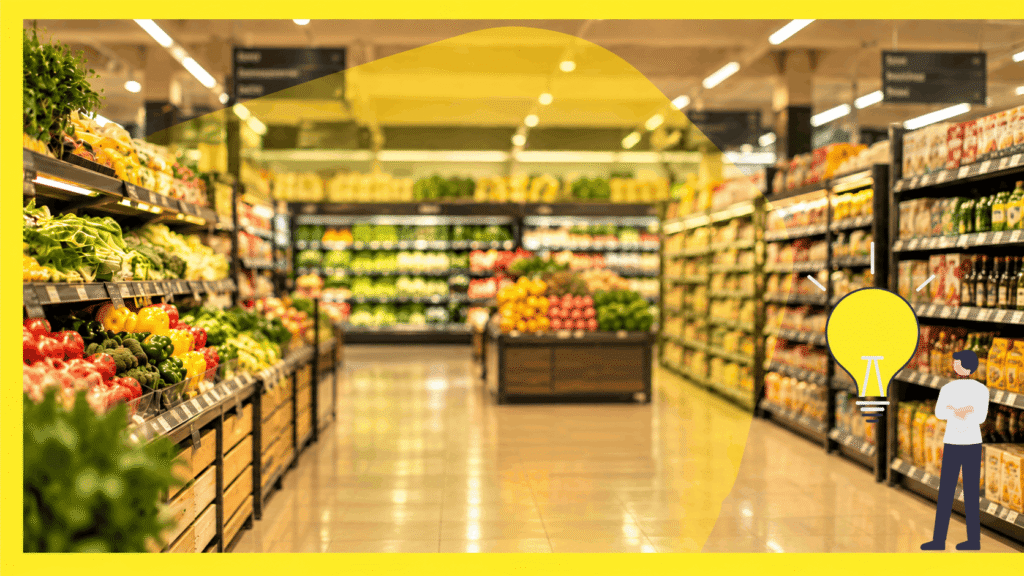
On-shelf availability can look strong while shoppers struggle to finish the trip they planned. In a 2026 study, Retail Economics and DHL Supply Chain audited grocery products at more than 100 UK store locations. They found 89.7% on-shelf availability, rising to 97.1% when comparable substitutes were included. Those substitutes were identified in the audit, not confirmed as acceptable by each shopper.
In the study’s separate household survey, 44% of consumers said they had switched supermarkets or added another one in the past year because of stock availability issues. A missing product can change what someone buys, send them to another store or leave part of a shopping list unfinished. An in-stock rate tells your teams what was available. To find out which gaps disrupted a trip, you need the shopper’s view.
What is on-shelf availability?
On-shelf availability (OSA) is the proportion of checked products that are on the shelf, findable, and available to buy when shoppers need them. It differs from the inventory recorded in the building.
A common calculation is:
On-shelf availability rate = (available product checks ÷ all eligible product checks) × 100
An available product check means a shopper could buy the item at the time of the check. Use the same checking method when comparing stores or periods.
Inventory accuracy is part of the picture. Your system may record ten units even when shoppers cannot find one on the shelf. Staff may have left the item in the stockroom, put it in the wrong place or logged it wrong. Retailers call this phantom inventory.
How retailers measure product availability in stores
You probably already measure product availability in stores in three ways: inventory and sales records, shelf audits, and shelf monitoring. Each answers a different question.
Inventory systems flag low stock, compare expected inventory with sales and help replenishment teams decide what to move. Sell-through patterns can suggest a gap when a product that normally sells stops selling, although you need accurate records and a reasonable expectation of demand to interpret the change.
Shelf audits let your staff check whether a product is present, in the right place, priced and accessible. They can expose discrepancies that inventory records miss, but each audit shows the shelf at the moment someone checked it.
Shelf monitoring adds more frequent checks. Cameras, robots and connected shelf technology can help your teams spot empty spaces, misplaced products or planogram compliance issues, depending on which shelves the technology covers and what it can detect.
All three approaches are valuable. They help you identify where products are missing and why. What they can’t tell you is whether those gaps stopped shoppers from buying what they came for.
What the in-stock rate misses
The stockout cost of a missing item depends on the product and the shopper’s purpose. One missing line among many can still be the only reason someone made the trip, and some stockouts cost far more than others. Gareth Johns, TruRating’s Chief Data Officer, explains the difference with a simple example:
“If I’ve been sent to the shop to buy ginger, I have no idea what my substitute for ginger is. But if I’ve been sent for a pepperoni pizza, I can come home with a ham and mushroom and it’ll probably be okay.”
Gareth Johns, Chief Data Officer, TruRating
Some substitutions are easy and some are not. A shopper who cannot find one soft drink might choose another. Someone cooking a specific recipe may have no obvious replacement for a missing ingredient. A preferred organic product or essential fresh item may also be harder to swap than a packaged alternative.
So fix the hard-to-replace lines first when shoppers keep reporting incomplete trips at the same stores or times. And a substitute sale can still leave the basket smaller, which is worth accounting for in your lost sales estimate.
Why planned shoppers raise the stakes
Retail on-shelf availability takes on a different meaning when shoppers have decided part of the trip before entering the store. A missing item can interrupt a planned meal, derail an essential errand and change what the shopper buys that day.
The AlixPartners 2026 Grocery Shopper Perspectives report found that, among US survey respondents who said financial pressure had changed their grocery shopping in 2025, 61% were planning meals more and resisting impulse purchases. The research does not tell us which ingredients they failed to find, but it helps explain why being able to complete a planned shop deserves attention.
In TruRating’s Shopper Insights 2026 research, shopping-list use increased at a discount grocer we work with. In September 2026, 60.4% of paying shoppers used a shopping list, up from 56.0% in October 2025 and the highest reading since the question began.
At the same grocer, the share of paying shoppers trying to buy organic rose from 41.0% in January to 43.6% in September 2026. A preference for organic products can narrow the substitutes shoppers are prepared to accept.
Planning differs across retailers. At another grocer we work with, shopping-list use ranged from 23% to 28% between July and September 2026, so you need your own customer data before deciding which lines deserve closer attention.
In some retailer data, Gareth has seen patterns consistent with more cooking from scratch, which could mean fewer ready meals. These observations do not establish a market-wide shift, but they give you another reason to check the ingredients that could leave planned meals unfinished.
Measuring availability from the shopper’s side
Improving on-shelf availability starts with finding out whether shoppers completed the trip they intended to make. You can ask one question at payment:
“Did you find everything you came for today?”
With point of payment feedback, TruRating asks one anonymous question as a customer pays. Each answer is linked to the verified purchase, not the shopper’s identity. You can compare answers with basket contents, spend, store and time of purchase.
The shopper-reported “found everything” rate adds context to your in-stock percentage. Your shelf report could look strong while a steady share of paying customers say they did not find everything. Breaking those answers down by store, daypart or shift can point your teams toward a recurring issue.
Compare the answers with basket data and your availability records. Do shoppers answering “no” spend less in certain stores or periods? Do inventory gaps appear at the same times? Treat any patterns as leads for the store team to check.
How to improve on-shelf availability
To improve on-shelf availability, focus on the products shoppers won’t swap, alongside the total number of product checks passing an audit.
- Identify the lines shoppers are least willing to substitute: start with essential ingredients, core fresh products and lines with a clear preference attached, such as organic. Compare customer answers with category sales, known out-of-stock periods and substitution patterns, then decide which lines warrant closer monitoring.
- Review shopper-reported gaps alongside shelf data: compare the “found everything” rate with your on-shelf rate by store, daypart and shift where you have enough answers. When the measures disagree, check for misplaced, hard-to-find or unmonitored products.
- Adjust replenishment to when shoppers need access: have shelves ready before known peaks and examine what happens when you restock during store hours. Gareth has observed that ease-of-movement ratings in smaller stores can fall when aisles get crowded. Replenishment may improve availability while making products harder to reach. Review store layout and timing together.
- Give fresh and recipe-critical lines closer attention: fresh availability takes more work than counting units on hand. Your team may have to pull an item for its condition or shelf life, so match deliveries and quality checks to demand, then track whether shoppers found what they needed.
- Use store teams to test and fix what the numbers suggest: give managers a specific issue to investigate, such as afternoon shoppers struggling to find a core ingredient. Check the shelf, change the replenishment or placement process, then see whether your customer answers and availability checks improve. Focus coaching store teams on the fix your teams can repeat.
Five KPIs that tell a fuller availability story
Your on-shelf availability KPIs should cover what is on the shelf, the possible sales impact and whether shoppers completed their intended purchases. Use these five measures together:
| KPI | What it tells you | What it cannot tell you alone |
|---|---|---|
| On-shelf availability rate | Share of eligible product checks where the item was available to buy | Whether the missing item was essential to someone’s trip |
| Out-of-stock rate | Share of eligible checks where an item was not available | Whether shoppers accepted a substitute |
| Lost sales estimate | Modeled sales at risk based on demand and unavailable products | The exact amount customers would have spent |
| Substitution acceptance | How often shoppers accepted an alternative, where this can be measured | Whether the replacement met the shopper’s needs |
| Shopper-reported “found everything” rate | Share of valid answers from paying shoppers who found everything they came for | Which product was missing or how many nonbuyers left |
Review these by store and daypart. Chain-wide averages can hide local gaps. Your broader retail metrics can help you compare availability trends with basket value and transaction patterns while accounting for promotions, seasonality and traffic changes.
Keep the assumptions behind any sales estimate visible. Substitutes and split trips make your lost-sales estimate less precise, and differences in basket size are associations rather than proof that availability caused the change.
A better question than “Was it in stock?”
Shelf data tells your teams what to fix. Shopper answers tell them what to fix first. Together, they help you focus on the products missing from planned purchases and check whether changes in the store improve the experience.
The Shopper Insights 2026 report explores how shopping lists, product preferences and changing trip patterns affect decisions in stores. You can also watch the Shopper Insights 2026 webinar to hear Gareth Johns discuss the findings.
To compare what customers say they found with what they bought, book a TruRating demo. TruRating adds the shopper’s view to the stock and sales information your teams already use.
Useful resources
- The store operations guide to retail excellence
- Customer insight analysis – strategies and techniques
- How to improve customer experience in retail stores
- Retail data – how analytics and AI are redefining store performance
- Retail conversion rate calculator
Frequently asked questions
Practical answers to common questions about measuring and improving product availability in stores.