

Teams usually look for a Qualtrics alternative to fill specific visibility or collection gaps in their customer experience programs. Some need greater in-store visibility, higher response volumes, simpler survey administration, more complete website feedback, or customer evidence linked directly to a purchase.
This guide compares eight platforms against those needs. Medallia supports large enterprise voice-of-customer programs. NICE CXone and Verint suit contact center and service operations. Sprinklr connects feedback with social and digital conversations. SurveySparrow and Zonka Feedback offer focused survey workflows. HappyOrNot captures fast location-based sentiment. TruRating collects high-participation feedback in real time at the point of payment, linked to the transaction, and reaching reporting as customers answer rather than at the end of a survey cycle.
InMoment is not included as an independent alternative. Press Ganey Forsta acquired InMoment in 2025, and Qualtrics completed its acquisition of Press Ganey Forsta on May 18, 2026. InMoment is therefore now part of the wider Qualtrics group.
Qualtrics alternatives compared
| Platform | Best suited to | Primary collection or evidence | Time from event to usable data | Typical program scope |
|---|---|---|---|---|
| Medallia | Enterprise voice-of-customer programs | Surveys, calls, chat, digital behavior, social and operational signals | Real time. Customers answer inside the payment, and their answers reach your reporting as they happen, from a large share of the customer base. | Broad enterprise CX |
| NICE CXone | Contact center and customer-service operations | Voice, digital conversations, workforce data and interaction analytics | Minutes. The conversation is the data. You hear from customers who called or messaged you. | Enterprise contact center |
| Verint | CX automation and workforce operations | Voice, messaging, interaction analytics, workforce data and feedback | Minutes for service interactions, for the same reason. Survey feedback follows the usual lag. | Enterprise service operations |
| Sprinklr | Social, digital and customer-service conversations | Social, voice, chat, messaging, reviews and digital channels | The platform picks up public posts as customers write them. Solicited follow-up adds days. | Enterprise social and digital |
| SurveySparrow | Focused survey and CX programs | Email, web, mobile, in-app and offline surveys | You wait for the invitation to go out, then for the customer to answer. Usually a day or more. | Focused to mid-market |
| Zonka Feedback | Feedback collection and closed-loop workflows | Surveys, websites, apps, kiosks, reviews, tickets, chats and calls | A day or more by email. Immediate when a customer taps a kiosk on site. | Focused to mid-market |
| HappyOrNot | Broad physical-location sentiment | Smiley terminals, touchscreen kiosks, QR, NFC and digital buttons | Immediate. Customers press a button before they leave the store. | Physical-location feedback |
| TruRating | Transaction-linked evidence and point-of-purchase research | One rotating question during payment, in store, online and across other touchpoints | About an hour. Customers answer inside the payment, and their answers reach your reporting as they happen, from a large share of the customer base. | Mid-market to enterprise customer-facing businesses |
Swipe horizontally to view the full comparison.
How to read this table. The first three columns describe what each platform is built around, which tells you more about fit than a feature list will. The fourth column tells you how long you wait between a customer experiencing something and your team being able to act on it. The two things that drive that wait are when you ask the customer, and how long you need to gather enough answers to trust a result at the level you plan to use it.
Watch that second part with the contact center platforms. They capture the conversation as it happens, so they win on raw speed, but you only hear from customers who chose to contact you. Broad survey programs invert the problem. They can reach your whole customer base, but a small fraction writes back, days later. Judge any platform on both properties.
Why do teams look for a Qualtrics alternative?

Channel visibility

Response volume

Decision-level detail

Speed to action
Most teams evaluating alternatives want to close a gap in their program rather than replace the whole thing. Some do want to replace it outright, usually once enterprise platform costs outgrow the value coming back. Both are reasonable starting points, and they produce different shortlists.
If you are filling a gap, ask which platform runs deepest in the channel that matters most to you. If you are consolidating or cutting spend, ask which platforms cover every customer-facing touchpoint without enterprise-scale licensing.
The gap is usually one of four things:
- You cannot see into an important channel
- You cannot collect enough responses to support a decision
- You cannot get operational detail beneath the headline result
- Your teams get the answer too late to use it
Teams underestimate the last one. Your Q4 result lands in February, and by then the trading period it describes has closed and the business decisions it should have informed are already made.
Qualtrics covers customer experience, employee experience and market research. Its research platform includes advanced survey design, panels, brand research, product studies and specialist methods. CX teams choose a broad platform for a good reason as it gives several programs one governed home.
Breadth is worth having. The question you need to answer is whether a broad platform runs deep enough in the one channel that matters most to your business. Teams start looking elsewhere once they find their program collects too little evidence from that channel and cannot give teams insight specific enough to act on.
Weigh implementation scope too
Platforms of this scale usually need specialist partners, complex integrations, user permissions, reporting structures, governance and someone internal who owns the program. An enterprise organization can absorb that. A mid-market organization pays much of the same overhead for a smaller return, and that arithmetic is what starts the cost conversation.
The participation gap
The collection method matters as much as the software. Receipt surveys average under 1% participation. Email surveys commonly reach around 5%. Both methods hear from customers who notice the invitation and decide to respond after the event. Both methods under-sample average customers, and email response rates continue to decline. The problem has become acute even in long-running government-sponsored economic surveys, where declining response rates now threaten data quality and, in some cases, the viability of routine surveys. Brookings examines the issue in more detail here.
This does not make traditional survey research invalid. A carefully designed study involving an individual customer can reveal detailed issues across that customer’s experience and multiple touchpoints. But a 5% sample and an 84% sample are not the same instrument. They provide different levels of evidence when a team needs to compare individual locations, products, customer groups or trading periods.
Participation on its own is not the point either. A brand could reach a high response rate and still learn little if every answer arrived as one blended score for the whole organization. What closing the participation gap actually buys is a sample that is granular and representative at the same time e.g; enough responses, from enough of the real customer base, to break the number down by location, shift and daypart and trust that it reflects who walked through the door that day.
A useful comparison is mystery shopping. A mystery shop shows what happened at one store, at one time of day, during one person’s visit. It is good at correcting what it catches. High-participation feedback works on the same principle at a different scale, allowing businesses to monitor every location, every hour and every day continuously.
Why timing affects participation
Timing affects response rates because it changes how much work answering requires. A survey sent two days later asks the customer to notice a message, open it, follow a link, load a page and recall an experience they have moved on from. Each of those steps loses people.
A question asked during the experience removes those steps, so more customers answer.
TruRating averages 84% participation in stores and 43% online. In both cases, the customer is asked during the transaction rather than through a separate invitation later.
For more detail, read:
- What is a good survey response rate?
- How survey fatigue affects customer feedback
- How to increase survey response rates
- How genuine customer voices are drowned out by the vocal minority
Feedback needs financial context
Each platform provides some commercial context. What narrows this further is linking each response to the transaction record behind it, so you can see what the customer bought and how much they spent. An NPS® or satisfaction dashboard with no revenue attached tells you sentiment moved in a channel. It cannot tell you whether fixing that channel earns back what you spend on it.
“Service felt slow” means one thing for a $200 Saturday purchase and another for a $12 weekday lunch, and your response to each should differ. Enterprise platforms can make this connection. They join survey responses to transaction data and report commercial measures like average transaction value.
A receipt survey gets there too, when enough people scan the code, an analyst or tool matches the responses to sales records, and you have a joined dataset. Three things separate one approach from another:
- Which customers make it into the joined data: a receipt survey only links the customers who scanned, and those customers skew toward the delighted and the annoyed. Your system ends up joining a lopsided slice of your customer base to your full sales ledger, then reporting spend patterns as though the slice represented everyone. Ask the question inside the payment and the join covers a large share of customers rather than volunteers.
- How far down you can cut it: linkage and volume do different jobs, and you need both. Linkage gives each response a commercial coordinate: this store, this basket, this daypart. Volume gives you enough responses sitting on each coordinate to trust what you see there. A program with linkage and thin volume reports confidently at brand level and falls apart at location level because a single Tuesday lunch shift has four responses behind it. Neither property fixes the other.
- Coverage of physical interactions: email and receipt invitations struggle to reach enough in-store customers to support store-level analysis. Several enterprise platforms address this by partnering with specialist providers, TruRating among them.
The dashboard is no longer the differentiator
The category has moved past survey collection and dashboard reporting for a reason. Any vendor can display a dataset, so showing you a score sets nobody apart. Producing a signal worth displaying is the part that stays hard: current, representative and tied to money.
When the answer reaches the decision
A joined dataset that lands weeks late still reads well in a report. Your operations team cannot use it. The trading week it describes has closed. The staffing pattern it should have changed has already run. And the manager who could have acted on it has moved on to next month’s numbers.
This is why the arrival time of the answer matters as much as its content. A quarterly review tolerates evidence that points in a direction. An operational decision needs the answer while the decision is still open.
What AI systems need from feedback
That requirement tightens as AI systems start recommending actions instead of summarizing results. An agent making a pricing, staffing or inventory call already has the what: the sales number, transaction count and redemption rate. It lacks the why.
A free-text comment collected days later cannot supply it in time. By the point someone classifies those responses and joins them to last week’s sales, your team has made the call. A satisfaction score arrives faster and carries no reason at all.
A quarterly report can absorb that weakness. An AI system ranking stores, products, campaigns or investment priorities cannot, because it repeats and amplifies whatever sample you gave it. Feed it a thin, self-selected slice of your customers and it will keep making decisions from that slice long after anyone remembers where the number came from.
See TruRating in action
What could better customer evidence show you?
See how TruRating connects high-participation customer feedback with transaction data to help teams understand what is driving experience and revenue.
Request a demo
Tell us a little about your business and a TruRating representative will get in touch.
By submitting this form, you can review how TruRating handles personal information in its Privacy Policy .
What are the eight main alternatives to Qualtrics?
The following alternatives cover different parts of the customer experience, research and feedback market. They are not ranked. Each solves a different problem, and each has a practical limitation.
1. Is Medallia a good Qualtrics alternative?
medallia.com, August 2026
G2: 4.5/5
Medallia is one of the closest alternatives to Qualtrics for large enterprise voice-of-customer programs.
Its customer experience platform combines direct feedback with signals from calls, chat, digital behavior, social channels and operational systems. It is designed to distribute insights and actions across large organizations rather than functioning only as a central survey tool.
Medallia can connect survey responses to transaction data and report commercial measures alongside experience scores. This makes Medallia relevant when customer evidence must be shared across digital, contact center, CX and frontline teams. Its speech analytics and conversational-data capabilities are particularly useful for businesses with high service volumes.
The practical limitations are cost and in-store coverage. Medallia is a substantial platform to implement and maintain, which can put it out of reach for smaller organizations or for a single defined program.
Like most enterprise CX platforms, its own high-volume visibility of the physical store interaction is limited, since in-store feedback is largely collected through receipt and email invitations. Medallia and TruRating partner to help close that gap for clients with customer-facing businesses.
Medallia is a strong choice when the business needs an integrated enterprise CX program, especially where contact center conversations, digital behavior and operational action are central.
2. Is NICE CXone a good Qualtrics alternative?
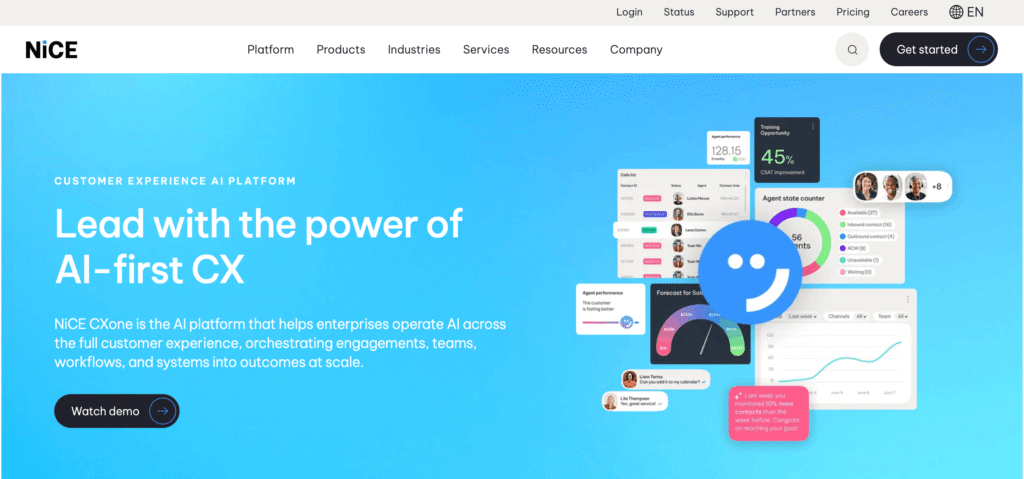
nice.com, August 2026
G2: 4.3/5
NICE CXone may be more appropriate than Qualtrics when contact center operations, workforce management and service delivery are the central requirement.
The platform combines voice and digital interactions with workforce engagement, quality management, analytics, self-service and agent-support capabilities.
This allows customer-service leaders to connect what customers say with how the contact center is staffed and managed. Feedback, scheduling, quality scoring and agent performance sit in one environment rather than being joined after the fact.
That is also its limitation. NICE CXone is not primarily a market-research platform. Teams that need panels, complex study design or broad brand research will need another system alongside it.
Choose NICE CXone when customer service, contact center performance, automation and workforce management need to operate together.
3. Is Verint a good Qualtrics alternative?
verint.com, August 2026
G2: 4.2/5 (Verint Voice of the Customer)
Verint is designed around customer experience automation, particularly in contact centers, back-office operations and digital-service environments.
Its platform combines interaction analytics, workforce management, quality tools, automation and voice-of-customer capabilities. This makes it relevant when a business wants customer insight to influence scheduling, service workflows, agent support and operational efficiency.
It is less direct when the main need is formal market research, product concept testing or a focused survey program. Buyers should also assess which parts of the broader Verint portfolio are required, rather than treating it as one narrow application.
Choose Verint when customer-service automation, workforce performance and interaction analytics are more important than formal research design.
4. Is Sprinklr a good Qualtrics alternative?
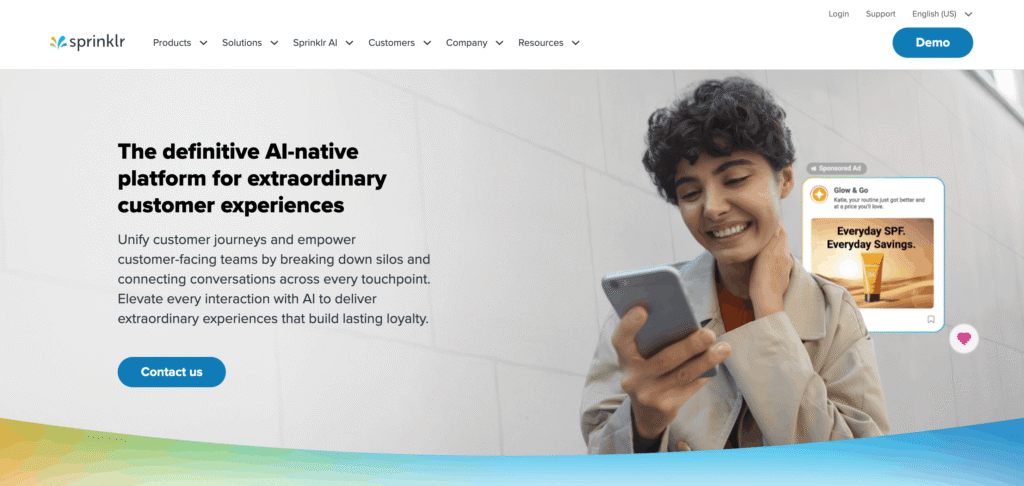
sprinklr.com, August 2026
Sprinklr is an enterprise platform built around digital, social and customer-service conversations.
It brings together customer service, social-media management, social listening, feedback and digital engagement. Marketing and social teams running inbound and outbound social programs are its most natural users. A complaint might begin through a social post, continue through direct messaging and move into a service workflow, and Sprinklr is designed to retain that context.
Its fit is narrower for a CX team running a broad NPS® or voice-of-customer program across physical and non-digital touchpoints. Social and digital conversations represent one part of the customer base, and coverage of in-store or in-venue experience needs to come from elsewhere.
Choose Sprinklr when social listening, customer service and digital engagement need to work together across a large organization.
5. Is SurveySparrow a good Qualtrics alternative?
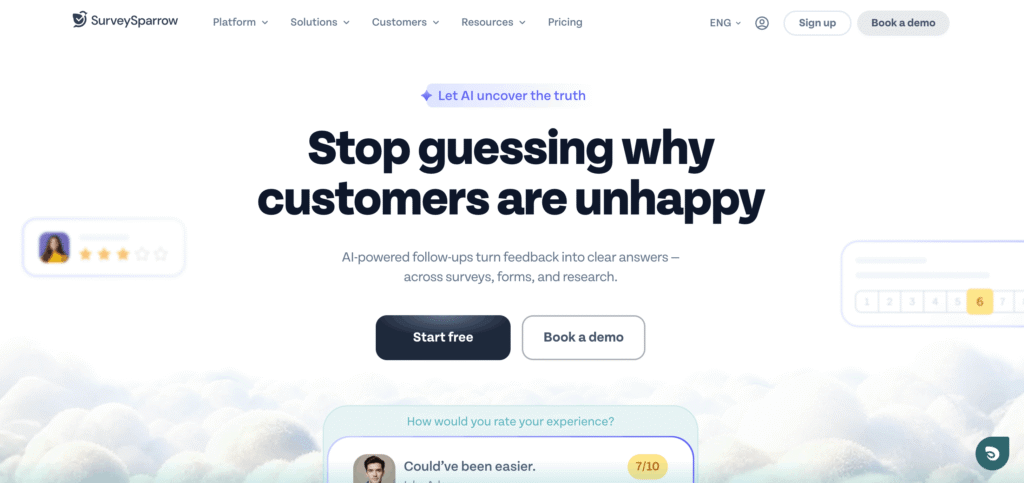
surveysparrow.com, August 2026
G2: 4.4/5
SurveySparrow is a survey and customer experience platform focused on accessible feedback collection across several channels.
Teams can use it for email surveys, website and mobile micro-surveys, in-app feedback, offline collection and recurring programs. Website questions can be triggered by actions such as a purchase or abandoned cart, allowing teams to ask while the experience is recent. It appeals to organizations that want more survey capability than a basic form builder, with straightforward administration for a small CX or insights team.
The limitation is that it remains survey-led. That leaves it exposed to the same falling response rates affecting every invitation-based program, which matters most when teams need store-level or segment-level results rather than a brand-wide score. Teams that need contact center infrastructure, panel research or feedback already joined to transaction data will need additional technology.
Choose SurveySparrow when the priority is creating and distributing accessible multichannel surveys through a more focused platform.
6. Is Zonka Feedback a good Qualtrics alternative?
zonkafeedback.com, August 2026
G2: 4.7/5
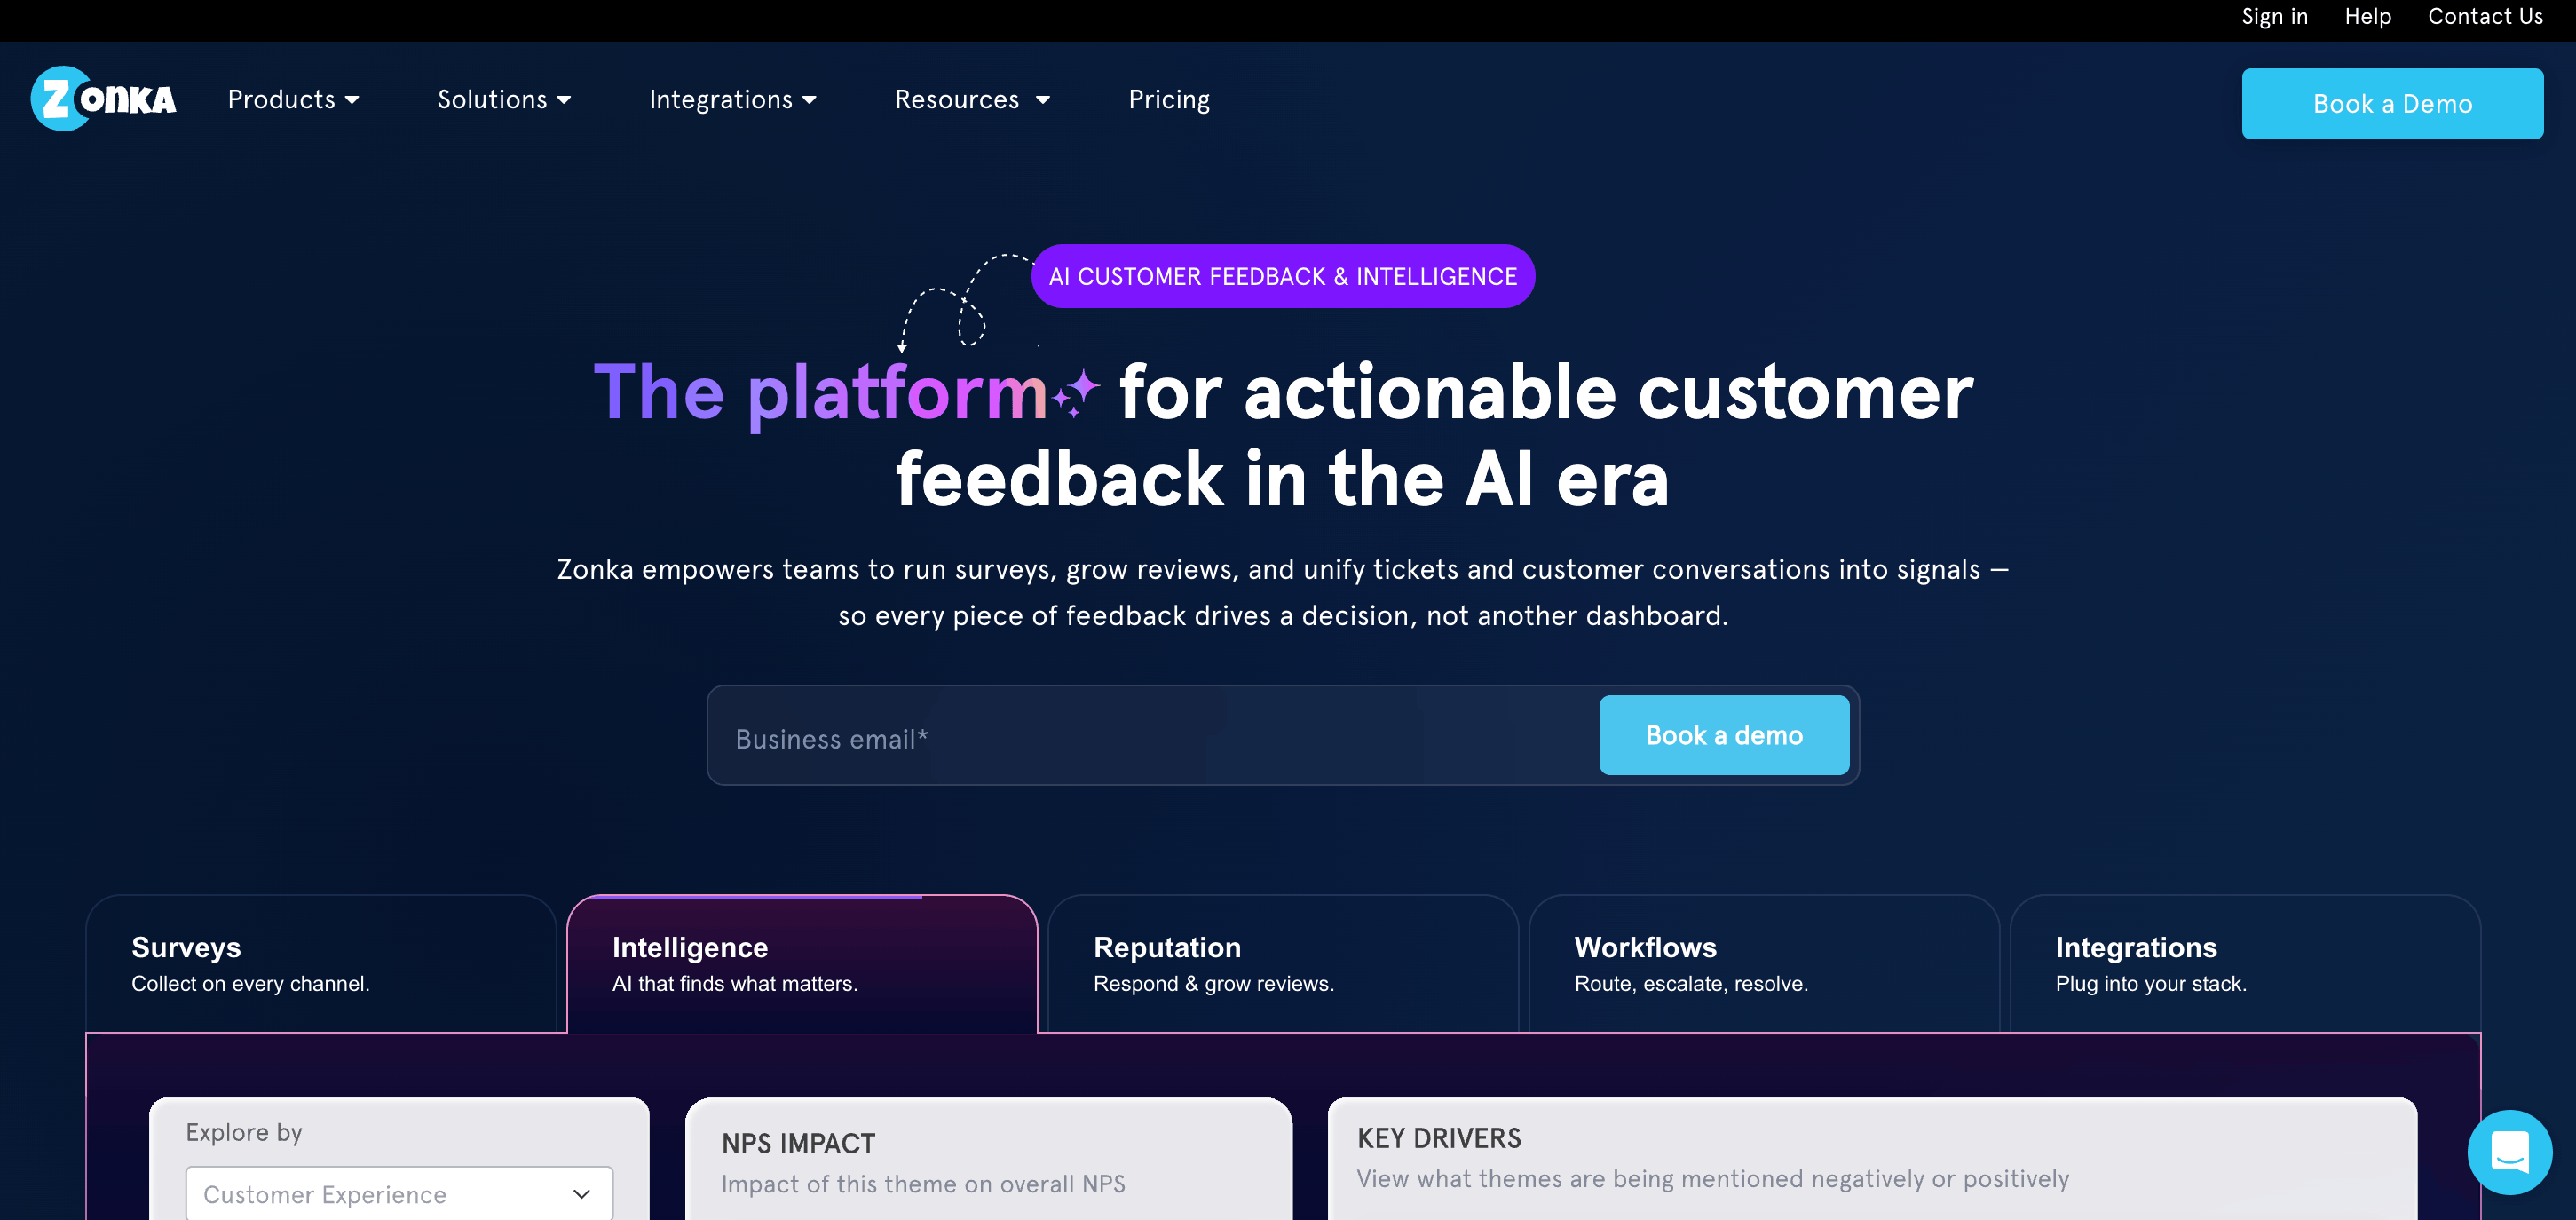
Zonka Feedback combines survey collection, feedback analysis and closed-loop workflows.
It can collect responses through email, websites, apps, mobile devices, kiosks and offline touchpoints, and can bring together feedback from surveys, reviews, tickets, chats and calls. Alerts, ticket creation and task routing allow teams to move from a customer response into a defined action. This makes Zonka useful when responsibility for follow-up needs to be assigned rather than left inside a dashboard. Its location-based reporting suits multi-site hospitality, healthcare and service businesses.
The limitation is research depth. Zonka supports survey logic and multichannel distribution, but businesses needing panel sourcing, advanced study design or a full contact center stack will require additional systems.
Choose Zonka Feedback when the main requirement is multichannel feedback combined with alerts, ownership and closed-loop action.
7. Is HappyOrNot a good Qualtrics alternative?
happy-or-not.com, August 2026
G2: 3.7/5
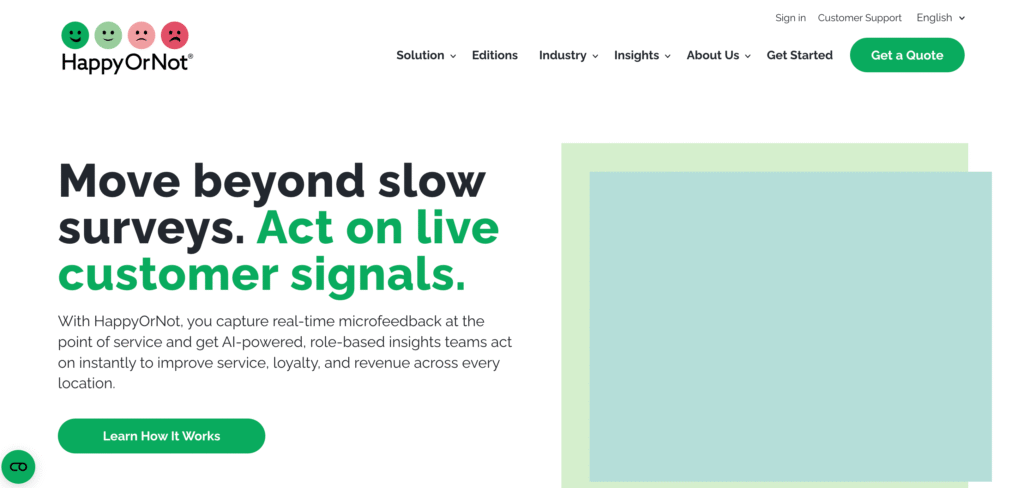
HappyOrNot is designed for fast, low-effort feedback in physical and digital environments.
Its best-known product is the Smiley Terminal, which lets customers press one of four buttons to record how they feel. The company also offers touchscreen terminals, QR and NFC collection, and digital feedback options. The approach works well in busy locations where a longer questionnaire would create too much friction.
Retail stores, airports, healthcare settings, public facilities and service environments can compare results by place and time. The first strength is operational. On-site button and kiosk collection captures a reaction at the location while the visit is still happening, with no app, link or login involved.
There are two limitations. The format is built for simple sentiment, so it answers how the visit felt but not much beyond that. And the response is not attached to a purchase, so it cannot show what the customer bought, what they spent, or which products and promotions were involved.
For businesses that want location feedback without a device in every site, TruRating uses QR codes and NFC tags placed at key touchpoints, and the in-store question can run through the card reader already at checkout.
Choose HappyOrNot when rapid deployment and simple location-based sentiment are more important than purchase-linked evidence.
8. Is TruRating a good Qualtrics alternative?
trurating.com, August 2026
G2: 4.8/5
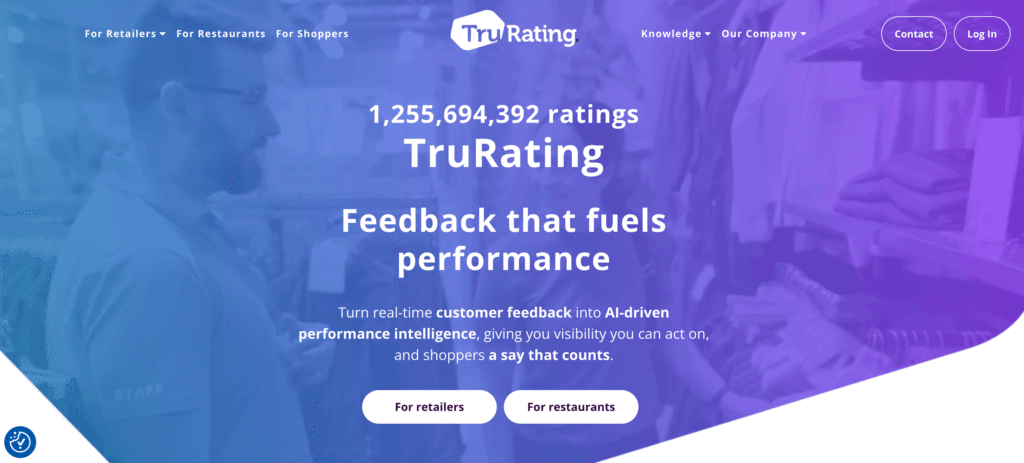
TruRating is a Qualtrics alternative for mid-market and enterprise customer-facing businesses that need greater location visibility and customer evidence connected to commercial activity.
It works alongside a central CX platform as often as it replaces one. The most common reason teams adopt it is a collection gap: the physical store, restaurant or venue interaction is where much of the experience happens, and it is the hardest place to gather representative feedback at volume.
One rotating question appears during the payment process with an average 84% participation rate in stores, and each response can be joined to around 50 points of transaction information including products, basket value, location, time, channel and loyalty status. The link is made as the answer is given, not matched afterward, and results reach reporting in real time.
That combination of volume and context is what makes store, shift and daypart comparison possible, because the sample does not run out when results are broken down.
The same signal serves several teams: operations identifying execution gaps by site and shift, CX and digital teams testing whether a change landed, merchandising and marketing measuring products and campaigns against spend, and executives looking for revenue attribution.
TruRating also supports point-of-purchase market research, covering awareness, purchase drivers, brand switching and the effect of advertising on spend.
The limitation is the single sitting. A customer answers one question per interaction, so several linked answers cannot be collected at once, which rules out conjoint analysis, MaxDiff and matrix questionnaires. Because respondents are anonymous, cohorts can be built from what someone bought but not from who they are, so panel-style demographic or attitudinal segmentation is not available. Individual follow-up is only possible through post-purchase channels where a customer opts in. TruRating does not provide panel sourcing or complex branching logic. Those are genuine traditional CX platform strengths.
When should you choose TruRating?
Choose TruRating when store teams need something to act on daily rather than a monthly report, and when you need consumer insight fast enough to inform a decision that is still open.
Because the question is asked inside the transaction, 84% of customers respond in store, and each response arrives attached to what they actually bought.
That supports two things a survey program usually cannot: store- and shift-level operational detail specific enough to coach against, and quick-turnaround answers from a representative slice of real customers rather than a self-selecting few.
See TruRating in action
Want to see what transaction-linked feedback could show you?
See how TruRating connects customer feedback with transaction data to help teams understand what is driving experience and revenue across stores, products, campaigns and customer journeys.
Request a demo
Tell us a little about your business and a TruRating representative will get in touch.
By submitting this form, you can review how TruRating handles personal information in its Privacy Policy .
Collect feedback during the customer journey rather than waiting for a follow-up survey.
Connect responses with products, spend locations and other transaction context.
Give CX, insights, marketing and operations teams a shared signal.
Test changes and see where there is enough evidence to scale or investigate further.
How does TruRating work in practice?
Deployment
The question appears through the card reader already at checkout. That terminal has already been through procurement, is PCI certified and is integrated with the POS, so this is a capability switched on inside an existing investment rather than a new device for IT to secure, maintain and replace. Most businesses simply ask their payment partner to enable it.
Online collection uses a lightweight JavaScript implementation, and hosted URLs, QR codes and NFC extend collection to other moments including post-delivery, post-support, app journeys, receipts and campaign emails.
Impact at the register
TruRating studies have found no significant difference in transaction time. The response is a single keypress inside the payment flow, so there is no separate process for associates to run, no script reminding customers to keep their receipt, and no additional cost for paper or incentives.
Recognition without identity
In store, TruRating can recognize a returning customer without knowing who they are. A hashed token derived from in-store purchase behavior is unique to that retailer. It carries no name, contact details, demographics or attitudinal profile, and the customer remains anonymous to both TruRating and the business.
That allows a different kind of segmentation from panel research. Cohorts are built from what people actually did rather than what they said about themselves: frequent versus occasional shoppers, returning versus first-time customers, single-category versus cross-category baskets.
A panel tells you what a self-described customer type thinks. A behavioral cohort tells you what people who genuinely shop that way experienced, and what they spent.
Working across teams
Because the evidence is pre-joined to commercial context, it tends to be used by more than one function. As Olivia Crawford of PVH explains:
Every week we have a cross-departmental meeting to analyse our data, product, customer support, marketing. TruRating truly aligns every department in our business.
Olivia Crawford
Digital Content Manager, PVH

How quickly does TruRating’s feedback reach teams?
Responses reach reporting in real time as customers answer. What matters more is what that removes. A conventional program has three delays built into it, and they compound.
- The fielding delay. A survey has to be sent, noticed and completed. At a 5% response rate, a single store may need weeks before it has enough answers to say anything about itself.
- The matching delay. Responses collected separately from the moment of transaction have to be joined to sales data afterward, which is usually a scheduled process rather than a continuous one.
- The reporting delay. Once enough responses exist and the join is done, results are packaged into a cycle. Even if data feeds refresh daily, responses come too late to take action during the shift in which the issues happen.
Asking inside the transaction removes all three. Participation is high enough that a single store produces a usable daily sample. The transaction context is attached as the answer is given, so nothing needs joining later. And the result is available while the trading day is still running.
For a store manager, a pattern that appears at lunchtime can be addressed with that afternoon’s team, rather than in a monthly roll-up that arrives after the people involved have worked twenty more shifts.
For an AI system, the point is sharper still. A pricing agent testing a markdown needs to know whether value perception held before it scales the test to the next hundred SKUs, and a signal that arrives at the end of the reporting cycle cannot inform a decision made last Tuesday.
This is the difference between measuring and managing. A monthly score tells a business what happened. A signal available the same day lets it change the outcome while the outcome is still in play.
How does a rotating single question compare to a long survey?
One question at a time is a different operating model, not a smaller survey. The obvious objection is that one question cannot tell you much. That assumption holds when you are asking one person. It stops holding when you are asking nearly everyone.
In a conventional survey program, question capacity is limited by respondent patience. Every additional question can reduce completion, so teams front-load the questionnaire and ask everything at once because they may get only one opportunity with each customer.
At 84% participation, the constraint moves.
The limiting factor is no longer how much a single customer will tolerate. It is transaction volume, and a multi-site business has a great deal of that.
That changes how the program runs. Questions rotate and can be triggered by context such as basket contents, transaction value, channel or loyalty status.
A business might ask about checkout speed this week and product availability next. Over a month, the rotating set can cover the same broad subjects as a long questionnaire, with each answer coming from a wide cross-section of paying customers.
Questions also do not all need the same frequency. A shift-level read on service behavior needs asking often. A broader question about why customers chose the brand reaches statistical significance on a fraction of the responses.
Weighting the rotation lets a team run fast-moving operational questions and slower-moving strategic ones at the same time, from the same collection point.
One question at a time also avoids two familiar problems with long questionnaires: survey fatigue, and the way answers to earlier questions influence answers to later ones.
It also changes the pace:
- Capture. Ask one question of nearly every customer.
- Learn. View the result by store, product, channel or customer group within hours.
- Dive deeper. Put the follow-up question to the following wave of customers, informed by what the last one showed.
Teams reach a usable answer sooner because they do not need to wait for one large study to close before asking the next question.
Depth does not have to come from a longer form in one sitting. Because a returning in-store customer is recognizable as the same anonymous respondent, a picture can also build across visits rather than resetting each time.
How can transaction-linked feedback support market research?
TruRating’s targeted questions can be triggered by basket contents, transaction value and other purchase conditions. This allows teams to study awareness, purchase drivers, likelihood to switch, product response and the commercial effect of advertising among customers who have just completed a transaction.
This type of pre-joined feedback can segment commercial performance and identify propositions attracting higher-value customers. Teams can then use further research or controlled testing to decide whether the opportunity should be developed.
The same model can support CPG partnerships. Retailers can give brand partners access to point-of-purchase insight from actual buyers, help them understand why consumers choose competing products, and assess whether retail media or in-store advertising is influencing spend.
This is market research, but it uses a different method from a formal multi-question study. TruRating provides breadth among real buyers and joins stated opinions to observed purchases. Qualtrics, QuestionPro and Alchemer provide depth within each respondent through panels, long instruments and advanced study design.
Medallia vs Qualtrics: how do the two enterprise platforms compare?
The Medallia vs Qualtrics decision usually comes down to the center of gravity of the program. Both platforms support enterprise voice of customer and experience management. Qualtrics has a particularly broad formal research offering. Medallia has a strong emphasis on enterprise customer signals, conversational data and operational action.
Is Qualtrics or Medallia better for research?
Qualtrics is the more natural fit when formal research design is the main requirement. Its market-research platform covers surveys, brand tracking, product research, audience research and user-experience studies.
It supports advanced logic, panels and specialist methods such as conjoint and MaxDiff. This allows research teams to run studies in which each respondent answers several connected questions.
Qualtrics is also useful when one platform must support customer, employee, product, brand and market-research programs, and the completion of the Press Ganey Forsta acquisition in May 2026 extends its research and benchmarking assets further.
Is Medallia or Qualtrics better for operational CX?
Medallia is the more natural fit when the main goal is to combine feedback with calls, chats, digital behavior, social channels and operational systems.
Its speech analytics and contact center capabilities suit organizations analyzing large volumes of customer conversations, and its platform positioning gives more prominence to role-based reporting, frontline distribution and closed-loop action. Qualtrics also supports omnichannel experience management, so the choice is not simply whether a channel exists.
Buyers should compare the depth of each workflow, their existing integrations, formal research requirements and the systems already used by customer-service teams.
Which should you choose?
Choose Qualtrics when complex research, brand tracking, product testing, panels or employee experience are central to the program.
Choose Medallia when the priority is a large enterprise CX program that distributes customer intelligence into digital, contact center and frontline workflows.
Neither should be selected on an analyst position or review score alone. Test both against your own data, roles, integrations, permissions and action processes. A large business may also run either alongside a specialist tool that gathers a different form of customer evidence.
When is Qualtrics the right choice, and when is a specialist tool better?
Qualtrics is the right choice when an organization needs broad and technically sophisticated research capabilities. A research team may need to build long questionnaires, route respondents through different branches, manage quotas or use panels to reach a specific audience. Product and marketing teams may need conjoint analysis, MaxDiff, pricing research, brand tracking or creative testing. These use cases require several linked answers from each respondent and detailed control over study design.
Qualtrics also makes sense when a company wants one governed platform spanning customer, employee, product, brand and market research, or when it has already invested in Qualtrics skills, integrations, reporting and governance.
Replacing an established platform is not automatically valuable. A specialist tool is often better used alongside it to fill a defined collection or visibility gap. That gap is usually a channel rather than a feature. Formal research platforms create depth within each respondent and can reach audiences beyond current customers.
Transaction-linked point-of-purchase feedback creates breadth among people who have completed a real transaction, in real time, connecting their stated views with observed purchasing behavior at store and shift level.
Before choosing, ask seven practical questions:
- Do we need a detailed formal study or a continuous customer signal?
- Do we need visibility in physical selling environments or other customer-facing locations?
- Must responses be tied to known individuals, or will anonymity improve participation?
- Do we need several connected answers from each respondent, or one answer from many customers?
- What transaction, operational or behavioral data must sit beside the feedback?
- Which teams need to use and act on the evidence, and at what level of detail?
- How quickly must the program produce a usable answer?
Start with the business decision. Then work backward to the respondents, collection method, data and platform required to support it.
For teams that need greater in-store visibility and customer evidence connected to products, promotions, locations and spend, explore TruRating’s in-store feedback and point-of-purchase market research platform.
Frequently asked questions
Answers to common questions about Qualtrics alternatives, customer feedback coverage and transaction-linked research.