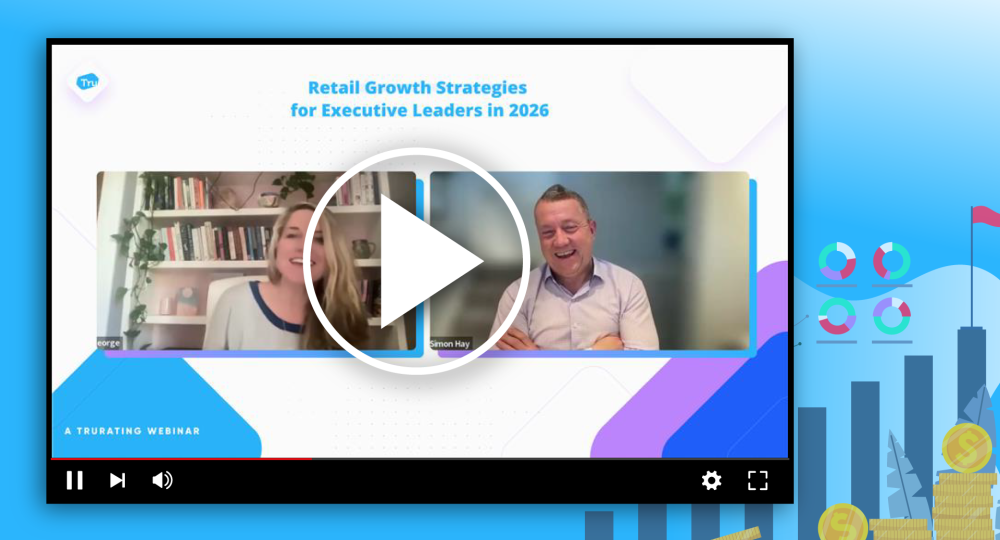


Shoppers did not simply spend less in 2026. They changed how they made decisions, what they were prepared to compromise on, and what mattered enough to protect. Those differences shaped the conversation between Simon Hay and Gareth Johns in TruRating’s Shopper Insights 2026 webinar.
Drawing on the Shopper Insights 2026 report, the two discussed what retailers can learn when they look beyond sales figures. Gareth, TruRating’s Chief Data Officer, leads analysis of customer answers collected at payment and linked to transaction data. His work connects what customers experience with spending and return visits.
Simon is a TruRating Board Advisor and former Global CEO of dunnhumby. He brings more than 40 years in data and customer insights, including work on Tesco Clubcard and championing dunnhumby’s partnership with Kroger in the US. Simon and Gareth first worked together at dunnhumby in the 1990s. Gareth went on to spend around 20 years there across the UK, North America and Europe.
Their discussion moved from shorter grocery trips and underused shopping apps to inconsistent service in apparel stores, before ending with a question about whether promotions leave customers feeling they received a good deal.
Watch the Shopper Insights 2026 webinar
Watch Simon and Gareth discuss what the findings mean for grocery planning, store service and promotions.
Where the findings come from
The discussion draws on TruRating data from participating retailers across North America, Europe, Australia and New Zealand. Every answer comes from one question at the payment terminal, answered in about two seconds by someone who has just paid, with the purchase verified and the answer anonymous. Point of payment feedback connects the answer to what was bought, how much was spent, and where and when the purchase happened.
Simon said TruRating collects around two million reviews a week across multiple countries and channels. That describes the wider platform, not the sample behind any individual finding. The webinar included data through September 2026.
What Simon and Gareth concluded
- Shopping decisions are becoming more deliberate: smaller grocery trips can reflect shorter planning horizons, not fewer store visits.
- Grocers may be undervaluing their apps: helping shoppers finish a planned trip could matter more than another offer.
- Friction matters to future visits: navigation and checkout difficulties can be more revealing than general service ratings.
- Apparel service needs to be proactive and consistent: many buyers enter without a specific item in mind, while service behaviors vary sharply between stores.
- Promotions do not guarantee a stronger sense of value: buying at a discount and feeling good about the price are different things.
1. Why the weekly grocery shop is giving way to shorter trips
Gareth began with a change that is easy to miss in sales totals. The report’s price backdrop draws on the US Bureau of Labor Statistics: food-at-home prices rose 2.2% and apparel prices 3.6% in the year to August 2026. In the grocery data Gareth discussed, dollar sales were barely ahead of the previous year, while fewer items were going through the register.
Customers were not necessarily visiting less. They were coming in more often and buying for the next day or two, sometimes just for that evening’s meal, rather than filling a basket for the week. That makes the purpose of each trip more specific.
And tighter budgets did not mean every preference was negotiable. At a European discount grocer, the share who said they tried to buy organic products rose slightly and finished at its highest recorded reading. Gareth described similar commitment among people prioritizing eating clean, and suggested that cooking from scratch may be gaining ground against ready meals.
“If I’ve been sent to the shop to buy ginger, I have no idea what my substitute for ginger is. But if I’ve been sent for a pepperoni pizza, I can come home with a ham and mushroom and it’ll probably be okay.”
Gareth Johns, Chief Data Officer, TruRating
His example changes how availability should be considered. A missing ingredient can disrupt the entire purpose of a planned trip; another product might be easily substituted. An overall in-stock percentage cannot show that difference.
2. Why Simon thinks grocers undervalue their apps
At a European discount grocer, shopping-list use rose from 56.0% in October 2025 to 60.4% in September 2026. At a US value grocer asking the same question, the share was much lower, between 23% and 28%. The behavior differs by retailer, but the European finding prompted a bigger discussion about what grocery apps are for.
Gareth pictured a list entered before the trip, with an app helping shoppers navigate the store, find substitutions and choose relevant offers or meal ideas. His son already loads the family’s shopping list into their local grocer’s app before setting out. But few apps have made that experience sufficiently useful to become routine.
Simon argued that retailers may be underestimating the app’s role.
“The app at the moment is, across many grocers, seen as nice to have, and an added extra.”
Simon Hay Board Advisor, TruRating
A grocery store can carry 7,000 to 30,000 products. Finding a handful of items quickly can be more valuable than scrolling through another set of offers. When TruRating asked what customers valued about grocery apps, navigation was the most consistently appreciated feature.
Gareth’s concern was the value exchange. Open an app and get bombarded with irrelevant promotions, and there is little incentive to open it again. Offers make more sense when they help someone complete the shopping list they already intended to buy.
3. Why Gareth thinks store friction has a bigger cost than retailers realize
Retailers ask customers about everything from freshness and friendliness to price and promotions. Gareth said the answers most closely associated with return visits in TruRating’s grocery client data were often about friction: moving through the store, reaching the checkout and completing the purchase.
“Everybody shops everywhere, every customer is everybody’s customer.”
Gareth Johns, Chief Data Officer, TruRating
That is the reality of cross-shopping behavior. A frustrating visit may not make someone abandon a retailer. Instead, they might return later or spend a smaller share of their grocery budget there. By examining repeat visits alongside anonymous customer answers tied to transactions, TruRating can study those differences rather than relying on stated intentions alone.
Gareth also described a tipping point in smaller stores. His team compared customers present at a particular time with store square footage. Beyond a certain density, ease-of-movement ratings fell, along with measures of return behavior. He gave no universal customers-per-square-foot threshold.
This raises practical questions about retail store layout and store operations. A gondola-end display might help sell an extra product but obstruct an aisle. Replenishment can improve availability while making a busy store harder to navigate. Prices and ranges can change; floor space is much harder to alter.
4. Why waiting for customers to ask for help misses the point
In apparel retailers TruRating works with, Gareth put the retail conversion rate at 15% to 20%. He then asked what the people who bought something had intended when they walked in.
At a US off-price department store, roughly two in five buyers said they came in just browsing, a share ranging from 37% to 42% across months in 2026. About three in ten buyers came for a specific item, and another three in ten intended to buy several things. These are answers from purchasers, not everyone who entered.
Even at an off-price retailer, where customers generally expect less involvement from store associates, a substantial proportion of people who ultimately purchased had arrived without a particular item in mind.
Gareth used a simple illustration: if 15% to 20% of visitors buy something and roughly three in ten of those buyers came for a specific item, that decided group would represent around 5% of total footfall. It is an approximate calculation, not a directly measured share of visitors at the off-price retailer.
“It’s not a reactive service model. It has to be much more of a proactive sales model.”
Gareth Johns, Chief Data Officer, TruRating
The implication for assisted-selling formats is not that every visitor needs an aggressive approach. It is that waiting to be asked favors people who already know what they want. Others may need help comparing products, understanding a recommendation or deciding whether to buy at all. The right level of assistance still depends on the retail format.
5. Why the same service playbook produces different results
Gareth described six common behaviors in assisted-sale retail: greeting, looking available to help, offering assistance, listening, recommending products and suggesting relevant additional items. Looking available is not the same as simply being scheduled on the floor.
Most stores are comfortable with the first two. The later, more demanding behaviors are less consistent. With most retailers TruRating starts with, Gareth sees gaps of 30 to 40 percentage points between stronger and weaker stores on some of those steps.
Differences also appear within a single store.
“Within an individual store, you’ll see a 10-point drop as the afternoon goes on.”
Gareth Johns, Chief Data Officer, TruRating
Scores can reach a low point in mid-afternoon before recovering near closing time. By comparison, Gareth said quiet and busy periods often differed by only two or three percentage points. Foot traffic explained much less of the variation than might be expected.
“It’s not square footage, and it’s not number of floors … it’s actually a cultural thing.”
Gareth Johns, Chief Data Officer, TruRating
He pointed to store managers, hiring, training and team culture. Smaller teams sometimes hold each other more closely to standards, while larger stores may struggle with turnover. These patterns caution against assuming that adding labor alone will resolve inconsistent service.
For coaching retail teams and retail staff training, the useful starting point is which behavior slipped, in which store, and at what time. Gareth described stores improving behavior scores by two to three percentage points over six months after concentrating on those gaps, rather than repeating the whole playbook.
For new locations, The First 90 Days guide provides a starting point for setting expectations and monitoring their delivery.
6. Why Gareth questions what a promotion really achieves
At a US athletic footwear retailer, the share of customers looking for discounts that day rose from 34.4% in February to 39.3% in June 2026. More people were actively looking for deals. But Gareth challenged the assumption that securing a discount necessarily makes someone feel better about the retailer’s prices.
“Those that buy on promotion actually score value perception of the retailer lower than those that don’t.”
Gareth Johns, Chief Data Officer, TruRating
That is an association, not evidence that promotions caused lower ratings. Discount buyers may arrive with different expectations. Gareth’s reading was that offers can pull sales forward, attract shoppers less invested in the brand and leave customers questioning whether a better deal is coming.
He recalled a retailer describing customers who felt they needed a calculator to work out which offer was best. Even after buying, some wondered whether they should have waited another week.
“Customers want promotions, and they’re looking for them. But I’m not sure they ever leave fully satisfied, even when they get them.”
Gareth Johns, Chief Data Officer, TruRating
For retail price optimization, the distinction matters. A promotion can bring forward a sale without necessarily improving how customers judge the retailer’s everyday pricing. Sales during an offer and confidence in the price paid are different things.
Explore the full Shopper Insights 2026 report
The webinar offers Simon and Gareth’s interpretation of selected findings. The full report contains the charts, time periods, samples and retailer-level differences behind them. Read the full analysis of consumer trends in 2026.
Final thought: the decision behind the purchase
The common thread in the conversation was that transaction totals rarely explain the decision behind them. A smaller grocery basket might reflect planning for tonight rather than the whole week. A delayed return visit might reflect the difficulty of navigating a crowded store. A discount can win a purchase without settling whether the customer feels the price was fair.
Simon and Gareth were not arguing that retailers should disregard sales data. They were showing why it needs context: what customers came in to do, what happened while they were there, and what they decided afterward. Those distinctions matter when choosing where to improve availability, simplify a store visit, coach teams or change an offer.
See the experience behind every sale
TruRating asks one anonymous question at payment and links the answer to the purchase. Retailers can compare what customers experienced, store by store and shift by shift, with what they bought and spent. That helps identify friction, examine service consistency and understand which experiences are associated with spending and repeat visits.
Book a demo or explore TruRating for business.