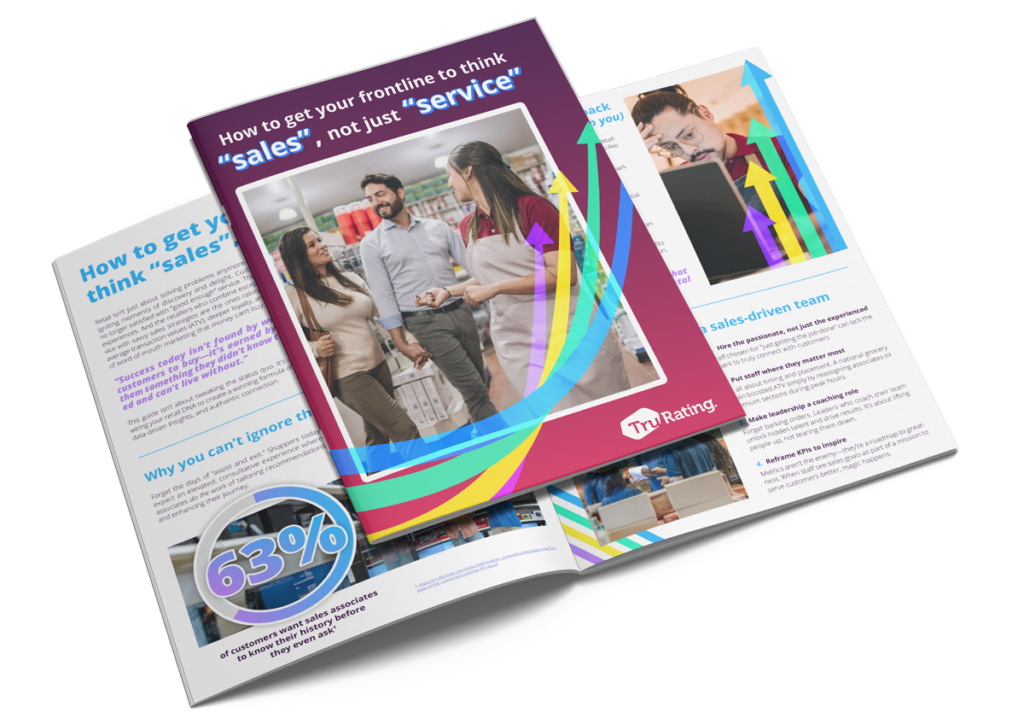
Struggling to turn store visitors into paying customers?
Download our Retail Conversion Analysis Guide to uncover proven strategies that drive purchases, improve customer experience, and boost your bottom line.
What’s the problem with conversion in retail?
Conversion is a top issue in retail. It’s getting harder to turn visits into purchases, or to grow baskets once shoppers are in-store. Part of this is the economic climate; part is behaviour shift. Customers spread purchases across multiple stores and hold retailers to higher standards on value, service, and convenience.
Many teams over-rotate to hearing from non-purchasers via focus groups, QR codes, exit surveys, or geo-located feedback. Those methods often skew to the most vocal few and produce limited, hard-to-action insights.
Common conversion blockers and quick fixes
Problem: Low in-store conversion
Top causes: Can’t find item · No staff help · Prices feel high · Out of stock · Messy store · Long queues
Fixes: Clear wayfinding & facing · Staff coverage at peaks · KVI price alignment · Gap-fill ordering · Recovery standards · Queue busting (express tills, mobile POS)
Measure: Conversion, ATV, UPT + in-moment purchaser feedback (found everything, help offered, price fairness, queue time)
Non-purchasers vs paying customers: what’s the difference?
Here’s the reality: non-purchasers and paying customers aren’t as different as we think. The reasons why someone doesn’t convert are often felt to the same extent as your purchasers.
The difference would be that there was enough in the positive column for them to go ahead with their purchase. So by focusing on feedback from your paying customers, you can gain valuable insights into the common barriers to purchase, whether it’s pricing, product availability, or customer service issues.
Our research has shown that there are a few common reasons why customers leave a store without making a purchase. These might seem like simple issues, but when left unaddressed, they can have a significant impact on your bottom line. Here are some of the key factors:
1. “I couldn’t find what I wanted”
A common frustration for many shoppers is the inability to find the product they’re looking for. Your purchasers can tell you if they also struggled, and would’ve spent more if they could have found everything.
2. “I couldn’t find anyone to help me”
The availability of helpful staff can make or break a shopping experience. If customers aren’t receiving the assistance they need, they’re likely to leave without purchasing. But paying customers might have felt this too, they just persevered a little longer and found things themselves.
3. “It’s too expensive”
Price sensitivity is another major factor in conversion. And paying customers can feel an item is too expensive, even as they’re buying it.
4. “You were out of stock of what I wanted”
Stockouts are a surefire way to lose a sale. Paying customers can tell you if they had to settle for a second option, or couldn’t get as much as they wanted.
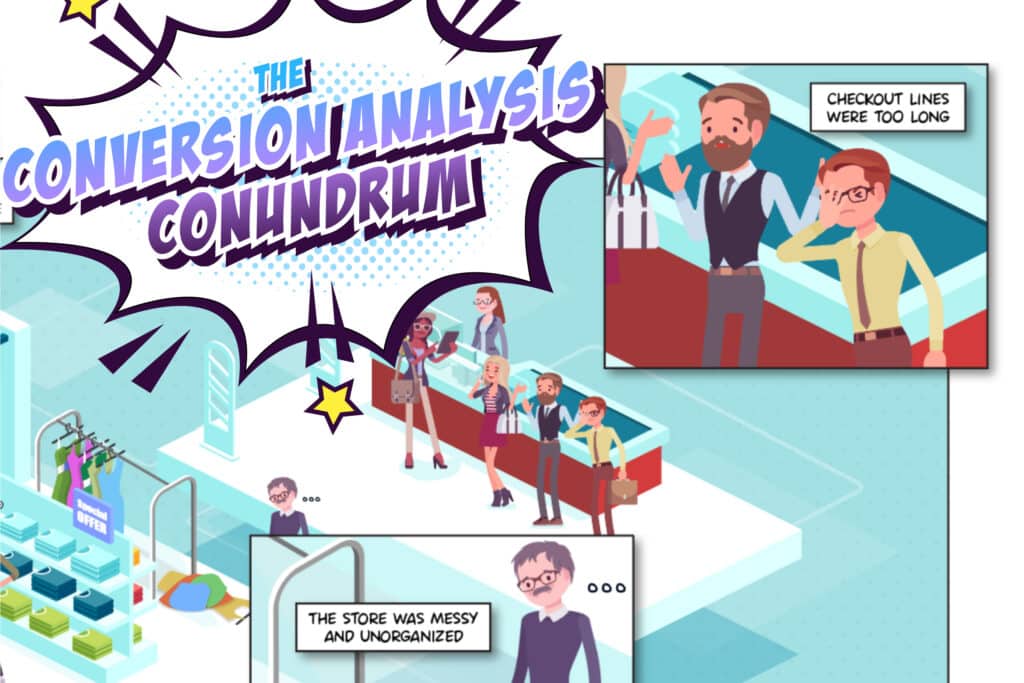
5. “The store was messy and disorganized”
A clean, organized store creates a pleasant shopping environment that encourages purchases. Your paying customers can tell you if your store’s in a bad state, even as they decide to look past that factor.
6. “Checkout lines were too long”
Long wait times at checkout can deter even the most enthusiastic shopper. But those that do stand the wait? They can tell you about it, and warn you of issues there that might be turning off less committed customers.
Asking purchasers about what drives them to buy
At the core, purchasers and non-purchasers often share similar shopping experiences, what differs is how those experiences are handled. By focusing on the experiences of those who do purchase, you can address the issues that might be deterring others.
This includes asking targeted questions at the point of purchase. These questions help you gather actionable insights directly from your customers, revealing the factors that influence their decision to buy, or not.
How to calculate store conversion
- Formula: Purchases ÷ Visitors × 100
- Example: 180 purchases from 1,200 visitors = 15% conversion.
- Impact math: Lifting conversion from 15% → 17% at 1,200 visitors adds +24 purchases/day. At a $32 ATV, that’s ~$768/day, ~$5.3k/week for a 7-day store.
Track conversion by store, daypart, and traffic source; compare to last year and matched weeks to remove seasonality noise.
Conversion, ATV, and UPT – how they work together
- Conversion = more baskets.
- ATV (average transaction value) = bigger baskets (price/mix).
- UPT (units per transaction) = attachment (cross-sell).
Optimize them as a system—e.g., queue busting may lift conversion and hold ATV by reducing abandonment, while KVI price credibility protects conversion without over-discounting the whole basket.
There’s a fine line between a purchaser and a non-purchaser. TruRating helps you stay on the right side. Don’t leave conversion to chance, download our 6-page guide on conversion analysis today and discover strategies to turn more of your visitors into loyal customers.
Useful resources
- Predictive analytics in retail – examples and strategies
- How technology is changing the retail industry
- Phygital in retail — bridging the gap between physical and digital CX
- Retail pricing optimization – strategies, models and examples
- 27 key retail metrics for your business
- 6 innovations retailers are investing in
FAQs
What is a good retail conversion rate?
Benchmarks vary by sector, season, and store maturity. As a directional guide, specialty retail often lands between 15–30%, grocery 20–40%, and big-box 10–20%. Use these as context rather than targets. Establish your own 13-week rolling baseline by store and daypart, then aim for comp-safe lifts (e.g., +1–2 pts) while protecting margin. Always compare like-for-like periods to account for promotions, weather, and holidays.
How can I improve in-store conversion quickly?
Fix the big blockers first: findability (signage/facing), help offered at peaks, KVI price credibility, stockouts, and queue times. Start with a one-week diagnosis (instrument queue length and OOS, add 1–2 purchaser micro-questions at checkout), then run a 3–4 week pilot in matched test/control stores. Scale only when conversion rises with stable margin and improved purchaser signals (e.g., “found everything” ≥90%).
Is price or service more important for conversion?
Both matter, and they interact. KVI price credibility prevents defection before the basket forms, while service (greeting and proactive help) reduces friction and increases attachment. If price feels unfair, service can’t fully compensate; if service is weak, even sharp pricing may underperform. Measure both together using purchaser signals (price fairness, help offered) alongside conversion/ATV/UPT to prioritise the next action.
How long should a conversion pilot run?
Plan for 3–4 weeks across matched test/control stores, or at least two promo cycles, to smooth out noise and observe durable effects. Define success up front: conversion ↑, gross margin $/store neutral+, and purchaser signals improving (e.g., “queue acceptable” trending up). Extend or iterate if external factors (weather, supply issues) distort results, and only scale once the effect repeats in a second region.


